

Alice M Saul, Bruce V Taylor, Leigh Blizzard, Steve Simpson-Yap, Wendy H Oddy, Nittin Shivappa, James R Hébert, Lucinda J Black, Anne-Louise Ponsonby, Simon A Broadley, Jeanette Lechner-Scott, Ingrid van der Mei and Ausimmune/AusLong Investigators
Abstract
Background:
A pro-inflammatory diet has been posited to induce chronic inflammation within the central nervous system (CNS), and multiple sclerosis (MS) is an inflammatory disease of the CNS.
Objective:
We examined whether Dietary Inflammatory Index (DII®) scores are associated with measures of MS progression and inflammatory activity.
Methods:
A cohort with a first clinical diagnosis of CNS demyelination was followed annually (10 years, n = 223). At baseline, 5- and 10-year reviews, DII and energy-adjusted DII (E-DIITM) scores were calculated (food frequency questionnaire) and assessed as predictors of relapses, annualised change in disability (Expanded Disability Status Scale) and two magnetic resonance imaging measures; fluid-attenuated inversion recovery (FLAIR) lesion volume and black hole lesion volume.
Results:
A more pro-inflammatory diet was associated with a higher relapse risk (highest vs. lowest E-DII quartile: hazard ratio = 2.24, 95% confidence interval (CI) = −1.16, 4.33, p = 0.02). When we limited analyses to those assessed on the same manufacturer of the scanner and those with a first demyelinating event at study entry (to reduce error and disease heterogeneity), an association between E-DII score and FLAIR lesion volume was evident (β = 0.38, 95% CI = 0.04, 0.72, p = 0.03).
Conclusion:
There is a longitudinal association between a higher DII and a worsening in relapse rate and periventricular FLAIR lesion volume in people with MS.
Keywords: Diet; EDSS; MRI; dietary inflammatory index; inflammation; multiple sclerosis; time to relapse and conversion to MS.
Introduction
Multiple sclerosis (MS) is a disease of the central nervous system (CNS).1 The formation of brain lesions, relapses, and disability are important measures of inflammatory disease activity or progression and can guide neurologists in treatment decisions.2
Within the CNS, acute and chronic inflammation is involved in the process of demyelination. Chronic inflammation alongside degenerative and reparative processes induces CNS scarring, leading to MS lesions that can be seen as areas of focal hyper-or hypo-attenuation captured on magnetic resonance imaging (MRI).3 Modulation of an inflammatory milieu presents opportunities for MS treatment that may reduce long-term disability progression.3
An inflammatory diet has been posited to contribute to chronic inflammation within the CNS, which can lead to the loss of immune cell tolerance.4 The Dietary Inflammatory Index (DII®)5 was developed to assess the potential of diet to cause chronic inflammation.6 It includes the examination of omega-3 and vitamin D intake, to which a higher intake of both has been consistently associated with a benefitting MS activity and progression in observational research. Trials, albeit limited, are less conclusive. A higher DII score has been associated with higher levels of inflammatory markers such as IL-6 (> 1·6 pg/ml, odds ratio (OR) = 1.19, 95% confidence interval (CI) = 1.04, 1.36) and homocysteine (> 15 μmol/l, OR 1.56, 95% CI = 1.25, 1.94),7 and with increased risk of cardiovascular disease and colorectal cancer and associated mortality.8,9 One cross-sectional study (n = 137) has previously examined the association between DII and MS outcomes, finding no association between DII and the number of relapses in the previous 2 years (p = 0.43), level of disability (Expanded Disability Status Scale (EDSS), p = 0.58) and presence of gadolinium-enhancing lesions on the most recent MRI scan (p = 0.62).10 While useful, this study has its limitations. The relapses in the previous 2 years or recent MRI lesions (associated with possible symptoms) may have resulted in an altered dietary intake, and the assessment of disability focused on actual disability rather than a measure of disability progression without, for example, taking disease duration into account.
Therefore, using a cohort recruited soon after their first clinical episode of CNS demyelination, our aim was to assess the prospective associations between DII score and MS outcomes, including, relapses, annualised change in disability (EDSS), fluid-attenuated inversion recovery (FLAIR) lesion volume and black hole lesion volume. We hypothesised that a more pro-inflammatory diet would be associated with worse MS outcomes.
Methods
We used data from the Ausimmune Longitudinal (AusLong) Study, which is a continuation of the Ausimmune Study, a multicentre case–control study including people with a first clinical diagnosis of CNS demyelination (FCD, n = 282, recruitment 2003–2006.11,12 This included progressive-onset cases, relapse-onset cases with an FCD but with a prior undiagnosed historical first demyelinating event (FDE), and classic FDEs as relapse-onset cases with a first episode of clinical demyelination without preceding demyelinating events.12
The AusLong Study followed participants annually (10 years, n = 225, the retention rate was 85% at a 5-year follow-up (240/282), and 81% (228/282) at a 10-year follow-up. We limited the study to participants who had converted to MS (n = 190). Data were available for annualised EDSS in 186/190 (98%) participants, total relapse count in 189/190 (99.47%) participants, MRI outcome data in 154/190 (81%) participants, and dietary data in 184/190 (97%) participants. Ethical approval was provided by human research committees associated with each of the participating centres, and all participants provided written informed consent.
Outcome measures
Relapse
Diagnosed relapses were ascertained from medical records and reported at annual reviews (verified by a neurologist). Relapses were defined as the acute or subacute appearance or reappearance of a neurological abnormality (2001 McDonald Criteria).13
Annualised change in EDSS
At the 5- and 10-year review, EDSS was assessed by a study neurologist. We calculated annualised change in EDSS from disease onset to the 5-year review by taking the 5-year EDSS score and dividing it by the duration between the day prior to the FDE date (EDSS assumed to be 0) and the date of the 5-year review.14 We calculated annualised change in EDSS from the 5- to the 10-year review by subtracting the 5-year EDSS score from the 10-year EDSS score and dividing it by the duration between the dates of the 5- and 10-year reviews.
MRI—FLAIR lesion volume and black hole lesion volume
MRI scans were performed at the 5- and 10-year reviews, using a standardised protocol. The full imaging protocol can be found in the supplementary section. Image analysis metrics were undertaken by Icometrix and were based on a previously published protocol detailing tissue class segmentation on T1-weighted images.15–17 Detection of lesions on FLAIR images was undertaken using outlier models. The metrics included FLAIR and black hole lesion volume (ml) in the juxtacortical, periventricular, and infratentorial regions of the brain, with a total lesion volume measure calculated from the sum of the three regions. We defined those using the same scanner (90% (140/154)) as those with scans taken on the same manufacturer of the scanner at both time points.
Food Frequency Questionnaire and DII
At baseline, 5- and 10-year reviews, a semiquantitative Food frequency questionnaire (FFQ), and the Dietary Questionnaire Epidemiological Studies (v2) developed by Cancer Council Victoria (Australia) assessed usual dietary intakes in the last 12 months.18 Frequency of consumption (standard-sized serve) was estimated for 104 individual foods, mixed dishes, and beverages, including alcohol. Food intake data were linked to NUTTAB providing Australian food composition data and estimated daily intakes of nutrients were provided by the Cancer Council of Victoria, using Australian food composition data.
The methodology for the DII is described in detail elsewhere.5 Briefly, based on the literature, a global database was developed of food parameters and their inflammatory effect scores, with values that were standardised to a representative range of dietary intake based on actual human consumption.19 An individual’s exposure to each food parameter was expressed as a z-score, being relative to the ‘standard global mean’. The values were converted to a percentile score to minimise the effect of ‘right skewing’ and were centred on 0 (null) and bounded between −1 (maximally anti-inflammatory) and +1 (maximally pro-inflammatory). The centred percentile value for each food parameter was then multiplied by the respective food parameter inflammatory effects to create a food parameter-specific DII score. Finally, all food parameter-specific DII scores were summed to create an overall DII score for each participant.
A minimum of 25 and a maximum of 45 parameters are required to generate the DII. The FFQ that we administered generated intake data for 27 food/nutrient parameters to combine into a total DII score (onion; garlic; tea; coffee; energy intake; carbohydrate; protein; total fat; alcohol; fibre; cholesterol; saturated, mono-unsaturated, poly-unsaturated fat; omega-3; omega-6; vitamins A, B1, B2, B3, C, D, E; folic acid, beta-carotene; iron; magnesium; zinc). For the E-DII, 25 food parameters were used because energy was in the denominator (i.e. intakes were expressed per 1000 kcal per day). DII scores were examined as continuous measures and quartiles. For all analyses, we excluded data from individuals with implausible energy intakes (>20,000 and <3000 kJ/day, n = 2). To account for the accuracy by which the participants report their dietary intake, we created a dietary reporting variable which was based on the ratio of total energy intake (EI) to basal metabolic rate (BMR) ratio (EI/BMR)20 (under-reporters ratio < 0.87; reliable reporters 0.87–2.75, over-reporters > 2.75).21 We calculated the BMR using the Harris and Benedict equation.22
Other measures
The baseline survey collected demographic data (age, sex, and study location) and factors that occurred prior to the study, such as ever smoked (yes/no). Annual reviews focused on changes since the previous review, including medication use, antidepressant and anxiolytic/sedative medication use, medications used to treat fatigue, whether employed (yes/no), whether changed diet or supplement use since the last review (yes/no), the total number of days in the past 12 months of doing any vigorous physical activity of > 10 minutes (modified version of International Physical Activity Questionnaire23), median weekly income ($AUD), education status, whether a smoker (yes/no) and presence and severity of 16 stressful life events (modified version of the Social Readjustment Rating Scale).24 A disease-modifying therapy (DMT) intensity score was developed that was weighted by DMT efficacy and took the duration of use into account. All DMTs were categorised from Category 1 (least effective) to Category 3 (most effective) based on previously published protocols.25 DMT durations were summed if they belonged to the same DMT category, then divided by the relevant study period (baseline to 5th year, and then to 10th year) and multiplied by 100 to obtain a percentage of time each DMT category was used. Each percentage was multiplied by a weight (weights for category 1 to three DMTs were 0.005, 0.01 and 0.02, respectively) and summed to create a total DMT intensity score.
Statistical analysis
Time to relapse
Time-at-risk began from the participant’s FDE date. To determine dietary inflammation across strata of predictors of time to relapse, we evaluated Kaplan-Meier curves and log-rank test of equality for categorical variables and the Chi-square test of univariate Cox proportional hazard models for continuous variables. Given we had multiple failure data for the relapse analyses, we fitted the model with a robust estimate of variance. The final model was tested to determine whether it satisfied the assumption of proportionality.26 If a predictor was found to be non-proportional, we stratified based on the non-proportional predictor or created a time-dependent predictor variable (_t*non-proportional predictor). We restricted to classic FDE participants who had reliable dietary reporting. We adjusted for age at baseline, sex, total energy intake (DII models), study site (E-DII models) and stratified by study site (DII models).
Annualised change in EDSS
We examined whether the DII scores at the 5- and 10-year reviews were associated with annualised EDSS change using transformed linear mixed-effects models for repeated measures; results were then back-transformed and presented on their original scale. We adjusted for whether people were experiencing a relapse at the time of the EDSS review, total energy intake (DII models only), employment status (DII models only), dietary reporting, age, and sex. Dietary reporting was presented as a dichotomous term (under-reporters/over-reporters versus reliable reporters). To rule out any diet changes from prior events, we performed a sensitivity analysis limiting to those cases that had a classic FDE at the study entry.
MRI outcomes
To examine the effects of diet inflammation, we examined whether DII scores at the 5- and 10-year reviews were associated with MRI outcomes at the 5- and 10-year reviews using transformed linear mixed effect models for repeated measures. The results were back-transformed and presented on their original scale. We excluded scans that were >1 year from their respective review (n = 23). We adjusted for total energy intake (DII models), dietary reporting, age, whether converted to MS (yes/no), annualised DMT intensity, and sex. We performed sensitivity analyses limiting to data from individuals who had scans taken on the same scanner (excluding n = 14 who were similar in terms of DII scores, annualised EDSS change, total energy intake, and age at cohort entry to those included (data not shown) and then further limited to those who had a classic FDE at study entry (n = 80 at the 5-year review and n = 77 at the 10-year review).
For all analyses, the section on ‘other measures’ describes the variables that were considered potential confounders and were assessed using directed acyclic graphs25 (DAGitty27) and traditional methods based on the definition of confounding.28,29 If they satisfied the definition of confounding, the models were adjusted for the potential confounder. In all mixed model analyses, we modelled a fixed effect, a two-level model and the between-person variability as a random effect by specifying the id. Model assumptions were met. To assess the possibility that relapses or increases in FLAIR lesion volume could have resulted in a worsening of dietary inflammatory potential, we examined the mean change in E-DII among those in the highest quartile of disease change between the 5- and 10-year review. All analyses were completed using STATA/SE 16.1 (StataCorp LP, College Station, USA).
Results
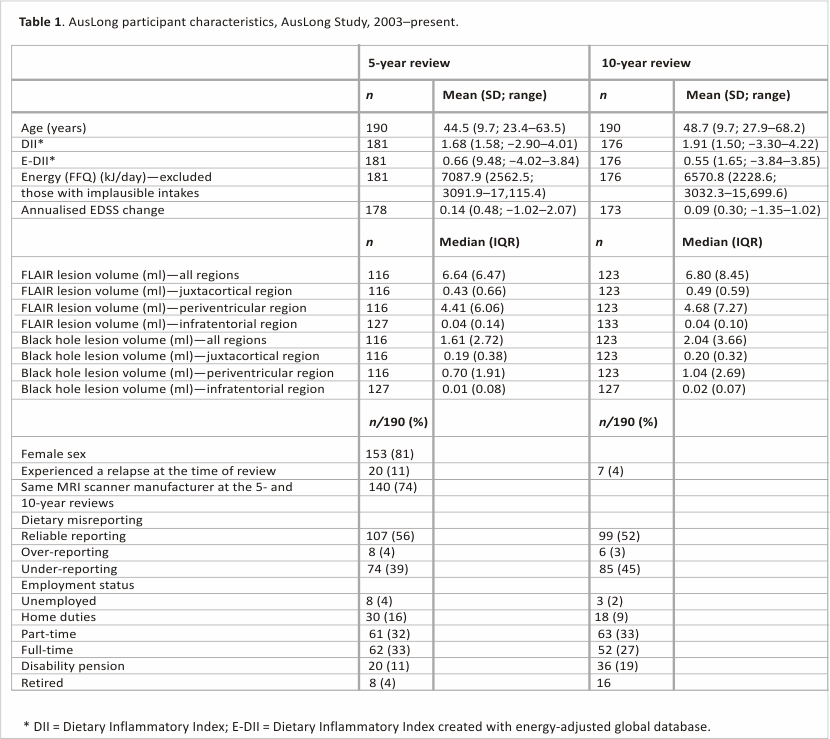
The cohort was mostly female (80.5%, Table 1) and had a mean age of 39.27 years (SD: 9.98) at cohort entry. The DII ranged from −2.89 to 4.01 at the 5-year review and −3.30 to 4.22 at the 10-year review. The E-DII ranged from −4.02 to 3.84 at the 5-year review and −3.84 to 3.85 at the 10-year review. The mean change between the 5-year and 10-year reviews for the DII and E-DII was +0.23 and −0.11, respectively.
The association between DII and E-DII and the time to relapse
When assessing DII in a continuous form, each one-unit increase in the DII increased the rate of relapse by 18%. When examining by quartiles, only the highest quartile was significantly different from quartile 1 (Table 2). Those with an E-DII score in the highest quartile had a relapse hazard that was 2.24 times higher than those in the lowest quartile, with a dose-response present and a significant test for trend (Ptrend: 0.03).
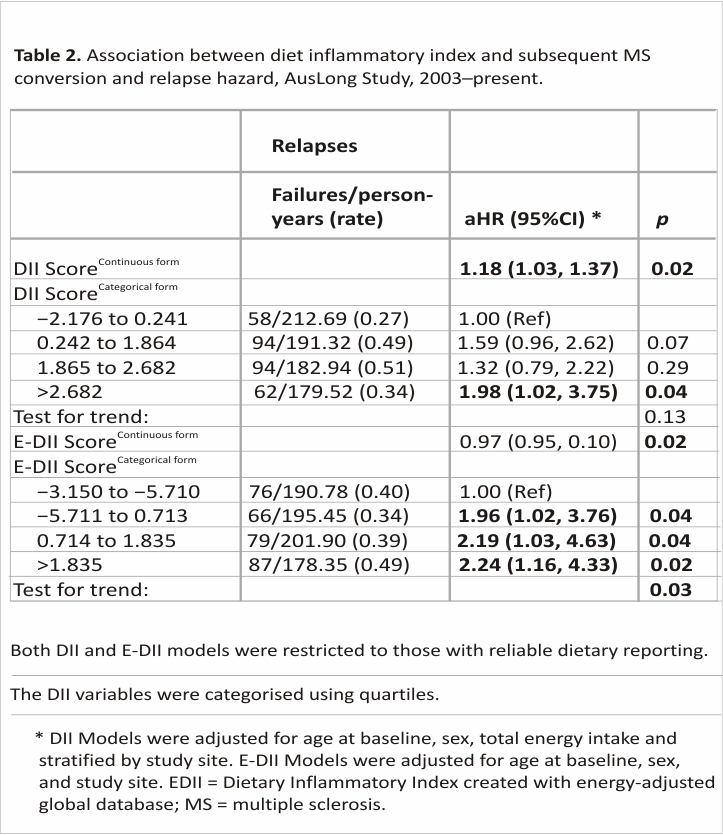
 Similarly, those with an E-DII score in the highest quartile had a relapse hazard that was 2.24 times higher than those with an E-DII score in the lowest quartile (Table 2). There was a dose–response present, a significant test for trend, and the model satisfied the assumption of proportionality.
The association between DII and E-DII with annualised EDSS change
There were no associations between DII or E-DII and annualised EDSS change, even when we limited to those with a classic FDE (data not shown).
The associations between DII and E-DII and MRI outcomes
After assessment of the mean infratentorial volumes, it was decided against proceeding with the analysis for this region because the mean absolute values were too low (Table 1).
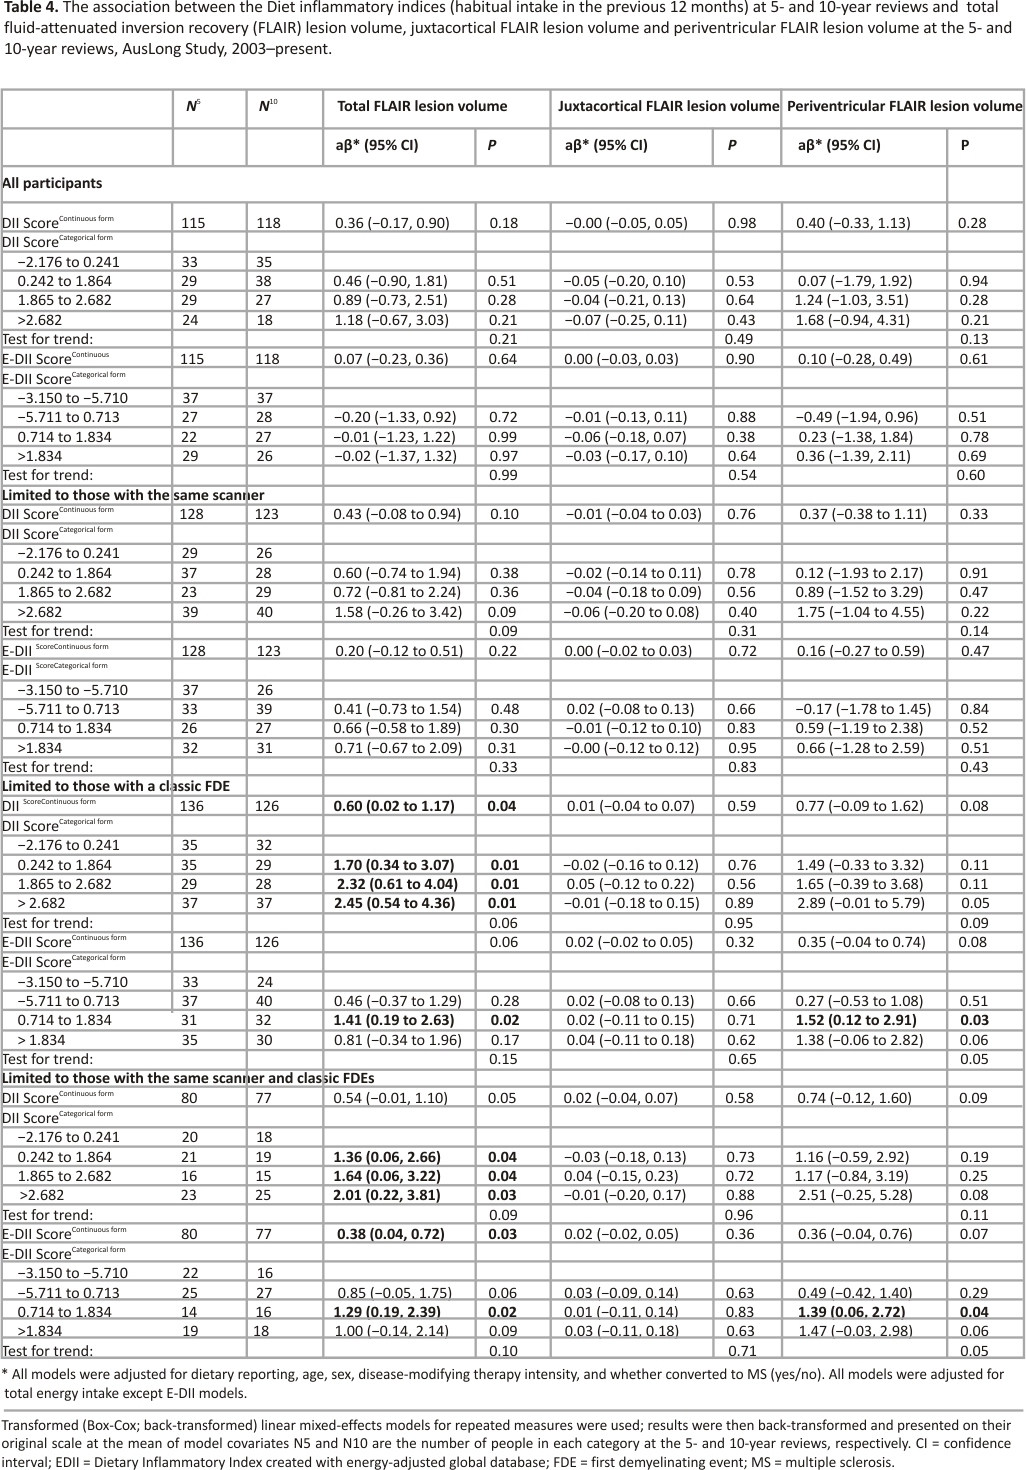
FLAIR lesion volume–There were no associations between DII or E-DII score and total FLAIR lesion volume, nor for lesion volume in the periventricular or juxtacortical regions. When we limited to those with the same scanner and a classic FDE at study entry, the magnitude of the effect increased and was more precise (Table 4). Among these participants, we found evidence of the association between DII and E-DII with total FLAIR lesion volume, such that those with a DII score in the highest quartile had a total FLAIR lesion volume of 2.01 ml higher than those in the lowest quartile (Table 4). This relationship was dose-dependent but the test for trend was not significant (p = 0.09). This was similar for the E-DII; however, a plateau effect was evident from the median E-DII and above (ptrend = 0.10). When comparing the associations with lesion volume in the two regions, it shows that the association with lesion volume in the periventricular region was stronger, although non-significant (e.g. highest vs. lowest E-DII quartile: β = 1.47,95% CI = −0.03, 2.98, p = 0.06).
Black hole lesion volume–There was no association between DII scores and black hole lesion volume (Supplemental Table 1).
Assessment of reverse causality
For those in the highest quartile of the number of relapses over the 10-year study period, the mean E-DII scores did not significantly change (mean E-DII at baseline review = 0.51, 5-year review = 0.54, p = 0.47 for difference; mean E-DII at 5-year review = 0.54, 10-year review = 0.46, p = 0.41 for difference). For those in the highest quartile of total FLAIR lesion volume change between 0.44 and 7.77 ml, the mean E-DII scores did not significantly change between the 5- and 10-year reviews (highest quartile total FLAIR lesion volume change: mean E-DII 5-year review = 0.78, 10-year review = 0.55, p = 0.17 for difference). Those with a worsening of E-DII in the highest quartile experienced little changes in E-DII scores over time, providing confidence that a worsening in disease was not inflating our findings.
Discussion
In this prospective study of people with MS, we found evidence that a more pro-inflammatory diet was prospectively associated with a higher hazard of relapse and a higher FLAIR lesion volume overall and in the periventricular region when limited to those assessed on the same manufacturer of the scanner and those with an FDE at study entry. No associations were observed with annualised EDSS change, or black hole lesion volume. This is consistent with a stronger association between DII score and inflammatory pathology leading to clinical relapses and subclinical periventricular lesions but less so with longer-term progression in disability and atrophy.
We found that higher DII scores were associated with a higher subsequent relapse risk with evidence of a dose–response. The effect sizes were clinically relevant, with those in the highest DII quartile having a relapse risk 2.45 times higher than those in the lowest quartile. This is a novel finding. There is only one cross-sectional study that has examined this and they found no association between the DII and relapse rate in the previous 2 years (p = 0.433).10
When we assessed the DII scores in relation to lesion volume, we found that a higher DII was associated with a higher FLAIR lesion volume in the periventricular legion with evidence of a dose–response and consistency with E-DII. While no clear associations were seen in the total sample, the associations strengthened somewhat when we limited to those with the same scanner (i.e. removing measurement error due to the use of different scanners). Importantly, the results were substantially strengthened when limiting to those with a classic FDE at study entry, suggesting that the adverse effects of a pro-inflammatory diet were more pronounced early in the disease process and not influenced by prior events. It also removes the confounding effect of longer disease durations being associated with higher MRI volumes. We found no evidence of association between DII and black hole lesion load, to our knowledge no other study has examined this.10
We did not find evidence of the association between the DII scores and annualised change in EDSS in this cohort followed for 10 years, suggesting that diet inflammation does not have an effect on long-term disability progression. The cross-sectional study, finding no association between the DII and absolute EDSS score (p = 0.50),10 is not useful as a comparison paper, as they did convert disability to a progression measure by, for example, taking disease duration into account.
The strengths of our study are that we were able to assess outcomes over a long period (10 years since FCD) capturing the complex mechanistic combination of timing of relapse, lesion, and disability changes across a crucial disease period with the correct temporality. While we cannot fully rule out reverse causality, we found that those with the greatest worsening in disease did not significantly change their DII scores between the 5- and 10-year reviews. For some analyses, the sample size was lower, which would have reduced the power to detect associations. While we considered many variables as potential confounders, there may have been some unmeasured confounding. Although we had sufficient variables to calculate the DII, there were 20/45 foods that could have been used to calculate the DII that our FFQ did not capture. While we applied the 2005 McDonald’s diagnostic criteria to define those who had converted, our analyses may have missed some cases that would have been captured using the revised diagnostic criteria.30 When assessing MRI outcomes, we did not examine associations with change, as only 96 participants had two MRI scans that were 4.5–5.1 years apart.
In conclusion, we found evidence to suggest that a more pro-inflammatory diet was associated with a higher hazard of relapse and greater FLAIR lesion volume in the periventricular region in people with MS. Pro-inflammatory food parameters of the DII include saturated fat, total fat, and trans fat, total energy, cholesterol, vitamin B12, and protein.5 Further prospective studies, including randomised control trials, are important to confirm that anti-inflammatory diets are beneficial on relapse rate and MRI markers in people with MS. The top five anti-inflammatory food parameters of the DII are turmeric, fibre, flavones, isoflavones, and β-carotene.5 While an anti-inflammatory diet does not replace anti-inflammatory medications in MS, this study provides evidence that an anti-inflammatory diet could contribute to the health and well-being of people with MS.
Acknowledgements
The authors express their heartfelt thanks to the participants in the Ausimmune and AusLong Studies without which they could not have undertaken this work.
The authors also thank the paid research personnel, including Susan Agland, BN, Hunter New England Health, Newcastle, New South Wales; Barbara Alexander, BN, Queensland Institute for Medical Research, Queensland; Marcia Davis, MD, Queensland Institute for Medical Research, Queensland; Zoe Dunlop, BN, Barwon Health, Geelong Hospital, Victoria; Rosalie Scott, BN, Royal Brisbane and Women’s Hospital, Queensland; Marie Steele, RN, Royal Brisbane and Women’s Hospital, Queensland; Catherine Turner, MPH & TM, Menzies Research Institute, Tasmania; Brenda Wood, RN, Menzies Research Institute, Tasmania; and the Ausimmune Study project officers during the course of the study: Jane Gresham, MA (Int Law), National Centre for Epidemiology and Population Health, The Australian National University, Canberra; Australian Capital Territory; Camilla Jozwick, BSc(Hons), National Centre for Epidemiology and Population Health, The Australian National University, Canberra; Australian Capital Territory; Helen Rodgers, RN, National Centre for Epidemiology and Population Health, The Australian National University, Canberra; Australian Capital Territory.
The members of the Ausimmune/AusLong Investigators Group are as follows: Robyn M Lucas (National Centre for Epidemiology and Population Health, Canberra), Keith Dear (University of Adelaide, Australia), Anne-Louise Ponsonby and Terry Dwyer (Murdoch Children’s Research Institute, Melbourne, Australia), Ingrid Van der Mei, Leigh Blizzard, Steve Simpson-Yap, and Bruce V Taylor (Menzies Institute for Medical Research, University of Tasmania, Hobart, Australia), Simon Broadley (School of Medicine, Griffith University, Gold Coast Campus, Australia), Trevor Kilpatrick (Centre for Neurosciences, Department of Anatomy and Neuroscience, The University of Melbourne, Melbourne, Australia). David Williams and Jeanette Lechner-Scott (The University of Newcastle, Newcastle, Australia), Cameron Shaw and Caron Chapman (CC, Barwon Health, Geelong, Australia), Alan Coulthard (University of Queensland, Brisbane, Australia), Michael P Pender (The University of Queensland, Brisbane, Australia) and Patricia Valery (QIMR Berghofer Medical Research Institute, Brisbane, Australia).
Declaration of Conflicting Interests
The author(s) declared the following potential conflicts of interest with respect to the research, authorship, and/or publication of this article: J.R.H owns controlling interest in Connecting Health Innovations LLC (CHI), a company that has licenced the right to his invention of the dietary inflammatory index (DII®) from the University of South Carolina in order to develop computer and smartphone applications for patient counselling and dietary intervention in clinical settings. N.S. is an employee of CHI. J.R.H. and N.S. calculated the DII scores and contributed to the data interpretation and writing of the manuscript, but they had no role in the data analysis.
Funding
The author(s) disclosed receipt of the following financial support for the research, authorship, and/or publication of this article: The Ausimmune and AusLong Studies was funded by the National Multiple Sclerosis Society of the United States of America (award no. RG3364A1/2) and the National Health and Medical Research Council of Australia (grant nos. APP316901 and 224215). LJB is supported by MSWA, an MS Australia Postdoctoral Fellowship and a Curtin University Research Fellowship. and AS funding as AS was supported by a Multiple Sclerosis Research Australia Postgraduate Scholarship.
References
1. Filippi M, Bar-Or A, Piehl F, et al. Multiple sclerosis. Nat Rev Dis Prim 2018; 4: 43.
2. Anlar O. Treatment of multiple sclerosis. CNS Neurol Disord Drug Targets 2009; 8: 167–174.
3. Sand IK. The role of diet in multiple sclerosis: Mechanistic connections and current evidence. Curr Nutr Rep 2018; 7(3): 150–160.
4. Esposito S, Bonavita S, Sparaco M, et al. The role of diet in multiple sclerosis: A review. Nutr Neurosci 2018; 21: 377–390.
5. Shivappa N, Steck SE, Hurley TG, et al. Designing and developing a literature-derived, population-based dietary inflammatory index. Public Health Nutr 2014; 17(8): 1689–1696.
6. Tredinnick AR, Probst YC. Evaluating the effects of dietary interventions on disease progression and symptoms of adults with multiple sclerosis: An umbrella review. Adv Nutr 2020; 11: 1603–1615.
7. Shivappa N, Hebert JR, Rietzschel ER, et al. Associations between the dietary inflammatory index and inflammatory markers in the Asklepios Study. Br J Nutr 2015; 113: 665–671.
8. Phillips CM, Chen LW, Heude B, et al. Dietary inflammatory index and non-communicable disease risk: A narrative review. Nutrients 2019; 11: 1873.
9. Marx W, Veronese N, Kelly JT, et al. The dietary inflammatory index and human health: An umbrella review of meta-analyses of observational studies. Adv Nutr 2021; 12(5): 1681–1690.
10. Da Costa Silva BY, de Carvalho Sampaio HA, Shivappa N, et al. Dietary inflammatory index and clinical course of multiple sclerosis. Eur J Clin Nutr 2019; 73(7): 979– 988.
11. Lucas RM, Ponsonby AL, Dear K, et al. Associations between silicone skin cast score, cumulative sun exposure, and other factors in the ausimmune study: A multicenter Australian study. Cancer Epidemiol Biomarkers Prev 2009; 18(11): 2887–2894.
12. Lucas RM, Ponsonby AL, Dear K, et al. Sun exposure and vitamin D are independent risk factors for CNS demyelination. Neurology 2011; 76: 540–548.
13. McDonald WI, Compston A, Edan G, et al. Recommended diagnostic criteria for multiple sclerosis: Guidelines from the International Panel on the diagnosis of multiple sclerosis. Ann Neurol 2001; 50(1): 121–127.
14. Pan G, Simpson S Jr, Van der Mei I, et al. Role of genetic susceptibility variants in predicting clinical course in multiple sclerosis: A cohort study. J Neurol Neurosurg Psychiatry 2016; 87: 1204–1211.
15. Jain S, Ribbens A, Sima DM, et al. Two-time point MS lesion segmentation in brain MRI: An expectation-maximization framework. Front Neurosci 2016; 10: 576.
16. Jain S, Sima DM, Ribbens A, et al. Automatic segmentation and volumetry of multiple sclerosis brain lesions from MR images. Neuroimage Clin 2015; 8: 367–375.
17. Smeets D, Ribbens A, Sima DM, et al. Reliable measurements of brain atrophy in individual patients with multiple sclerosis. Brain Behav 2016; 6(9): e00518.
18. Ireland P, Jolley D, Giles G, et al. Development of the Melbourne FFQ: A food frequency questionnaire for use in an Australian prospective study involving an ethnically diverse cohort. Asia Pac J Clin Nutr 1994; 3(1): 19–31.
19. Hebert JR, Shivappa N, Wirth MD, et al. Perspective: The dietary inflammatory index (DII)-lessons learned, improvements made, and future directions. Adv Nutr 2019; 10: 185–195.
20. Harris J, Benedict F. A biometric study of basal metabolism in man. Washington, DC: Carnegie Institute of Washington, 1919.
21. Goldberg GR, Black AE, Jebb SA, et al. Critical evaluation of energy intake data using fundamental principles of energy physiology: 1. Derivation of cut-off limits to identify under-recording. Eur J Clin Nutr 1991; 45(12): 569–581.
22. Black LJ, Zhao Y, Peng YC, et al. Higher fish consumption and lower risk of central nervous system demyelination. Eur J Clin Nutr 2020; 74(5): 818–824.
23. Craig CL, Marshall AL, Sjostrom M, et al. International physical activity questionnaire: 12-country reliability and validity. Med Sci Sports Exerc 2003; 35: 1381–1395.
24. Holmes TH, Rahe RH. The social readjustment rating scale. J Psychosom Res 1967; 11: 213– 218.
25. Hernán MA, Robins JM. Causal inference: What if, 2020, https://cdn1.sph.harvard. edu/wp-content/uploads/sites/1268/ 2021/03/ciwhatif_hernanrobins_30mar21.pdf
26. Austin PC. Statistical power to detect violation of the proportional hazards assumption when using the Cox regression model. J Stat Comput Simul 2018; 88(3): 533– 552.
27. Textor J, Van der Zander B, Gilthorpe MS, et al. Robust causal inference using directed acyclic graphs: The R package ‘dagitty’. Int J Epidemiol 2016; 45: 1887– 1894.
28. Hernán MA, Hernandez-Diaz S, Werler MM, et al. Causal knowledge as a prerequisite for confounding evaluation: An application to birth defects epidemiology. Am J Epidemiol 2002; 155: 176–184.
29. Willett WC, Howe GR, Kushi LH. Adjustment for total energy intake in epidemiologic studies. Am J Clin Nutr 1997; 65(Suppl. 4): 1220S–1228S; discussion 1229S– 1231S.
30. Thompson AJ, Banwell BL, Barkhof F, et al. Diagnosis of multiple sclerosis: 2017 revisions of the McDonald criteria. Lancet Neurol 2018; 17: 162–173.
Credits: Saul AM, Taylor BV, Blizzard L, Simpson-Yap S, Oddy WH, Shivappa N, Hébert JR, Black LJ, Ponsonby AL, Broadley SA, Lechner-Scott J, van der Mei I; Ausimmune/ AusLong Investigators. A pro-inflammatory diet in people with multiple sclerosis is associated with an increased rate of relapse and increased FLAIR lesion volume on MRI in early multiple sclerosis: A prospective cohort study. Mult Scler. 2023 May 6:13524585231167739. doi:10.1177 /13524585231167739. Epub ahead of print. PMID: 37148166.