

Dana T Goldberg 1, Anat Yaskolka Meir 1,2,✉, Gal Tsaban 1, Ehud Rinott 1, Alon Kaplan 1, Hila Zelicha 1, Nora Klöting 3, Uta Ceglarek 3,4, Berend Iserman 3,4, Ilan Shelef 5, Philip Rosen 5, Matthias Blüher 3,6, Michael Stumvoll 3,6, Ohad Etzion 7, Meir J Stampfer 2,8,9, Frank B Hu 2,8,9, Iris Shai 1,3,8,
Abstract
Background and Aims:
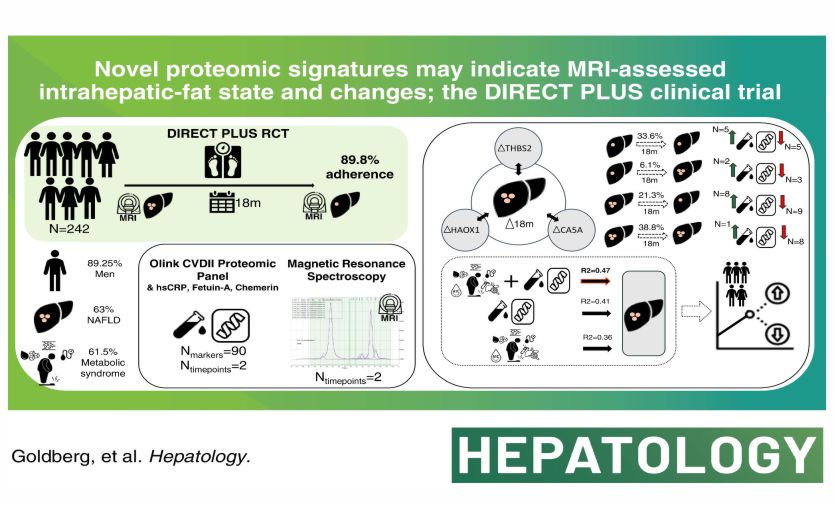
In the randomized 18-month DIRECT PLUS trial (n = 294), we demonstrated that a Mediterranean (MED) diet, supplemented with polyphenol-rich Mankai duckweed, green tea, and walnuts and restricted in red /processed meat, caused substantial intrahepatic fat (IHF%) loss compared with 2 other healthy diets, reducing NAFLD by half, regardless of similar weight loss. Here, we investigated the baseline proteomic profile associated with IHF% and the changes in proteomics associated with IHF% changes induced by lifestyle intervention.
Approach and Results:
We calculated IHF% by proton magnetic resonance spectroscopy (normal IHF% <5% and abnormal IHF% ≥5%). We assayed baseline and 18-month samples for 95 proteomic biomarkers. Participants (age = 51.3 ± 10.8 y; 89% men; and body mass index = 31.3 ± 3.9 kg/m2) had an 89.8% 18-month retention rate; 83% had eligible follow-up proteomics measurements, and 78% had follow-up proton magnetic resonance spectroscopy. At baseline, 39 candidate proteins were significantly associated with IHF% (false discovery rate <0.05), mostly related to immune function pathways (eg, hydroxyacid oxidase 1). An IHF% prediction based on the DIRECT PLUS by combined model (R2 = 0.47, root mean square error = 1.05) successfully predicted IHF% (R2 = 0.53) during testing and was more potent than separately inputting proteins/ traditional markers (R2 = 0.43/0.44). The 18-month lifestyle intervention induced changes in 18 of the 39 candidate proteins, which were significantly associated with IHF% change, with proteins related to metabolism, extracellular matrix remodelling, and immune function pathways. Thrombo-spondin-2 protein change was higher in the green-MED compared to the MED group, beyond weight and IHF% loss (p = 0.01). Protein principal component analysis revealed differences in the third principal component time-distinct interactions across abnormal/ normal IHF% trajectory combinations (p < 0.05 for all).
Conclusions:
Our findings suggest novel proteomic signatures that may indicate MRI-assessed IHF state and changes during lifestyle intervention. Specifically, carbonic anhydrase 5A, hydroxyacid oxidase 1, and thrombospondin-2 protein changes are independently associated with IHF% change, and thrombospondin-2 protein change is greater in the green-MED/high polyphenols diet.
Proteomics has the potential to provide extensive insights regarding an individual’s health status and the likelihood of developing certain diseases,1 while large-scale protein scanning has become available to identify biomarkers related to disease states2 and specifically in the context of NAFLD,3 which is highly prevalent,4 and can develop from hepatic steatosis to NASH, fibrosis, and cirrhosis.5,6
Hepatic steatosis, the first stage of NAFLD, is defined as intrahepatic fat (IHF) content exceeding 5%. 7 is associated with an increased risk of metabolic syndrome (Met syn), type 2 diabetes (T2D), cardiovascular and kidney disease, gut dysbiosis, liver and other cancers.8–16 IHF% accumulation is typically asymptomatic, but several biomarkers and noninvasive prediction tools for NAFLD diagnosis and staging are being used and investigated, as it is necessary to monitor the initiation and evolution of the disease. 17–24 An encouragement for combining omics with traditional biomarkers has recently emerged to improve diagnostic performance.17,23,24 In NAFLD, omics have been explored in different study settings, including cohorts, therapeutic interventions, and following bariatric surgeries.25–27
Recently, we reported in the 18-month DIRECT PLUS trial among 294 participants, with an NAFLD prevalence of 62% at baseline, that a green-Mediterranean (green-MED) diet, amplified with green plant –based proteins/polyphenols such as Mankai, green tea, and walnuts and restricted in red/processed meat can increase IHF% loss more than other healthy nutritional strategies and reduce NAFLD by half.16 Here, we aimed to identify, in the DIRECT PLUS lifestyle intervention trial, whether novel proteomic signatures may indicate an MRI-assessed IHF state and changes.
METHODS
Study population
This was a secondary analysis of the 18-month DIRECT PLUS randomized controlled trial. The DIRECT PLUS randomized controlled trial included 294 participants (age >30 y) with abdominal obesity (waist circumference: men >102 cm, women >88 cm) or dyslipidemia (TG >150 mg/ dL and HDL cholesterol ≤40 mg/dL for men, ≤50 mg/dL for women) who were recruited from an isolated workplace (Nuclear Research Center Negev). The participants were randomized to 1 of 3 lifestyle interventions: healthy dietary guidelines (HDGs), the Mediterranean (MED), or the green-MED diet, all combined with physical activity, where a monitored lunch was provided. Both MED diets were similarly hypocaloric and included 28 g/d of walnuts. The green-MED group further consumed green tea (3–4 cups/d) and a Wolffia globosa (Mankai) green plant shake.
IHF acquisition and quantification
The participants underwent MRI at baseline and the end of the intervention using proton magnetic resonance spectroscopy, as detailed.16 Briefly, localized, single-voxel proton spectra were acquired using a whole-body 3-Tesla MRI scanner (Philips Ingenia). Data were analyzed using the Mnova software (Mestrelab Research) by an experienced physicist blinded to the intervention groups. The total hepatic fat fraction in the image was determined as the ratio between the sum of the area under all fat peaks divided by the sum of the area under all fat and water peaks.
We determined distinct trajectories of IHF% based on the 18-month change: (i) normal-IHF% trajectory included subjects with IHF% <5% at the baseline and 18-month timepoints; (ii) normal-to-abnormal-IHF% trajectory included subjects with IHF% <5% at the baseline and IHF% ≥5% at the 18-month timepoints; (iii) abnormal-to-normal-IHF% trajectory included subjects with IHF% ≥5% at the baseline and IHF% <5% at the 18-month time- points; and (iv) abnormal-IHF% trajectory included subjects with IHF% ≥5% at the baseline and 18-month timepoints.
Proteomic panel and classification
The protein panel was assessed using the proteomics platform of the Olink CARDIOVASCULAR II panel. The Olink technique employs proximity extension assay technology28 in a homogeneous 96-well plate format. It incorporates 92 oligonucleotide-labelled antibody probe pairs per panel that bind their target proteins in serum. A PCR reporter sequence was formed, amplified, and quantified by real-time PCR following a proximity-dependent DNA polymerization event. Internal and external controls are used for data normalization and quality control. Intra- and inter-coefficients of variance (CV)% were based on control samples (pooled plasma samples) included on each plate. The average intra-assay CV% was 6%, and the inter-assay CV was 17%. This platform provides normalized protein expression data on a log2 scale. Further information regarding the Olink analysis can be found in the Supplemental Methods (https://links.lww.com/HEP/I360).
Three other proteins, high-sensitivity C-reactive protein, Chemerin, and Fetuin-A, were also added to the proteomic analyses on a log2 scale.
Based on prior literature (Supplemental Table S1, https://links. lww.com/HEP/I361), we classified 95 proteins according to the following pathway-related groups: metabolism, blood coagulation, blood pressure regulation, endothelial dysfunction, extracellular matrix remodelling, heart functioning, and immune function (Supplemental Table S1, https://links. lww.com/HEP/I361).
Data cleaning
We removed 5 proteins with more than 5% missing data (BNP, ITGB1BP2, SERPINA12, STK4, and PARP1) (Supplemental Figure S1, https://links. lww.com/HEP/I362), considering the study design, including sample size and experimental variables. We used the remaining protein data for the baseline (N=242) and 18-month change analysis (N=184, participants with complete data at baseline and 18 months).
Statistical analysis
The present study aimed to investigate the proteomic profile associated with IHF% in the DIRECT PLUS intervention trial. Baseline characteristics are presented as sex-specific IHF% tertiles. Continuous variables are presented as mean ± SD. The significance of trends between tertiles was assessed using the Kendall-Tau test. We used Spearman correlations to quantify the associations between protein levels and IHF%. The false discovery rate (FDR) was applied to correct for multiple testing, with FDR <0.05 as the significance threshold. The partial correlations were adjusted for age and sex and, in a subsequent analysis, for age, sex, and weight. For the 18-month change analysis, we adjusted for age and sex and, in a subsequent analysis, for age, sex, baseline weight, and weight loss. ANOVA and ANCOVA were performed to examine the changes in thrombospondin-2 (THBS2), hydroxyacid oxidase 1 (HAOX1), and carbonic anhydrase 5A (CA5A) proteins between the 3 intervention groups (HDG, MED, and green-MED), further adjusted for weight loss and IHF% loss by ANCOVA. The change of markers and IHF was calculated as the division between 18-month time-point values and values at baseline, unless otherwise stated. Tukey multiple comparisons of means analysis was used as a post-hoc analysis. We performed principal component analysis (PCA) and Linear Mixed Effects Model to examine the differences in the proteomic panel of distinct trajectories of IHF%, including preintervention and postintervention time points. Also, a volcano plot was used to present the differences in proteomics between different IHF% trajectories. Paired t-test or Wilcoxon signed-rank tests were used to compare 18-month changes in proteomic markers from baseline. The prediction of IHF% at baseline was performed by elastic net regression analysis, where 10-fold cross-validation was used, with a multivariate linear regression analysis performed to assess the prediction of known variables taken from the literature.21 Baseline data from the DIRECT PLUS was used as a training set. The DIRECT PLUS data at 18 months were used as a test set. We used the CENTRAL trial baseline data29 as a validation set. The CENTRAL trial has proteomic measurements for 212 individuals by the Olink platform with the additional proteins (high-sensitivity C-reactive protein, Chemerin, and Fetuin-A), with IHF% measured by the mDIXON approach as described.30 All variables were transformed into a log2 scale except sex and age. Statistical analysis was performed using R (Version 4.2.0). Statistical significance was set at a 2-sided alpha value of 0.05.
RESULTS
Baseline characteristics
Participants’ baseline characteristics incorporates 242 subjects (mean age= 51.3±10.8 y; 89.25% men; mean body mass index=31.3±3.9 kg/m2; mean of IHF% men=10.4±8.3 or women = 10±12.2). Among the 242 participants at the baseline, 149 (61.5%) individuals with Met syn (assessed based on Huang PL,31 Dis Model Mech. 2009), 24 (10%) with T2D (fasting plasma glucose levels ≥126 mg/dL or hemoglobin A1c levels ≥6.5% or if regularly treated with oral antihyper- glycemic medications or exogenous insulin), and 153 (63%) exhibiting NAFLD. Thirty-five (14%) individuals were using antihypertensive medications, 15 (6%) were prescribed antiplatelets, 28 (12%) were undergoing lipid-lowering therapy, 4 (2%) were receiving insulin treatment, and 14 (6%) were administered oral glycemic control medications.
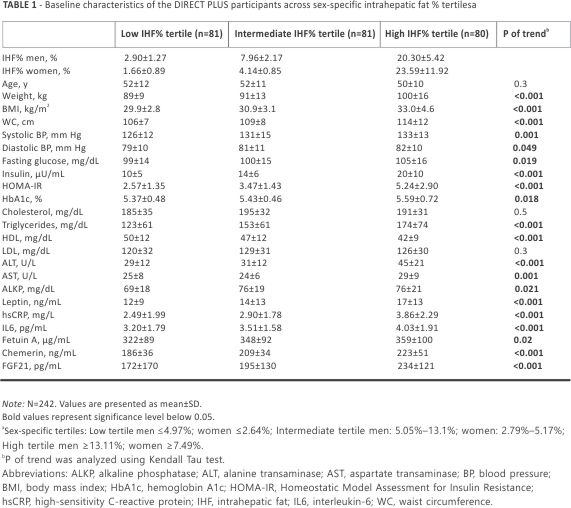
Further characteristics at the baseline are shown in sex-specific IHF% tertiles (Table 1). Age, cholesterol, and LDL cholesterol levels were similar across sex-specific IHF% tertiles. Individuals with a greater IHF% had significantly higher body mass index and waist circumference, markers of glucose metabolism, and inflammatory markers (p of trend <0.05 for all). Sex-specific IHF% tertiles stratified by body mass index are presented in Supplemental Table S2, https://links. lww.com/HEP/I362. Baseline characteristics across the DIRECT PLUS intervention groups among 242 and 184 participants are presented in Supplemental Table S3, https://links. lww.com/ HEP/I362.
Protein classification pathways and cross-sectional associations of IHF% and proteomic panel
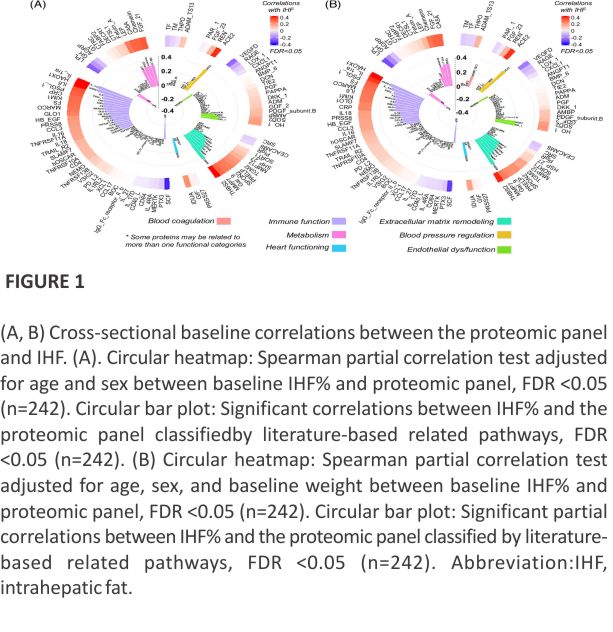
Baseline correlation analysis revealed that 34 proteins were significantly associated with IHF%. After adjustments for weight, overall, 35 proteins were significantly associated with IHF% at baseline. Several proteins changed following the adjustments; the correlations of LEP and TNFRSF11A with IHF% were attenuated, while ADAM_TS13, MMP12, and hOSCAR were found to correlate with IHF% (FDR <0.05). After adjustments for age and sex, 39 candidate proteins were significantly associated with IHF% at the baseline (Figure 1A; FDR values are shown in Supplemental Table S4, https://links. lww.com/HEP/I363). After adjustments for age, sex, and weight, 36 proteins were significantly associated with IHF% at the baseline overall. Several proteins changed following the adjustments; the correlations of TNFRSF11A, TRAIL_R2, and SLAMF7 with IHF% were attenuated, while ADAM_TS13 was found to correlate with IHF% (Figure 1B; FDR values are shown in Supplemental Table S4, https://links. lww.com/ HEP/I363).
Prediction of IHF% at the baseline by the proteomic panel and traditional variables
We constructed 3 models and used a published model by Kotronen et al21 to examine whether proteomics only, known variables from the literature, or a combination of the proteomic panel with the literature variables would enhance the prediction of IHF% (Table 2). Model 1 included only the proteomic panel (90 proteomics) with an R2 value of 0.41 and root mean square error (RMSE) of 1.11. Model 2 consisted of both proteomics and known variables (90 proteomics + 5 literature-known variables; aspartate transaminase, aspartate transaminase /alanine transaminase ratio, fasting insulin levels, and the presence of T2D and Met syn, input as forced covariates). Both models were performed with elastic net regression. Model 3 (multivariate linear model) included 5 variables as predictors of IHF% %. A 10-fold cross-validation was performed for all 3 models (Table 2). The values of R2 were calculated for all subjects at the baseline time point of the DIRECT PLUS trial. This overall R2 value describes the values received from all 10 models trained in the 10-fold cross-validation for each of the 3 models. The R2 value for model 1 was higher than that of model 3 (0.41 vs. 0.36), while the joint prediction model (model 2) had the highest R2 value compared to the other 2 models (0.47).
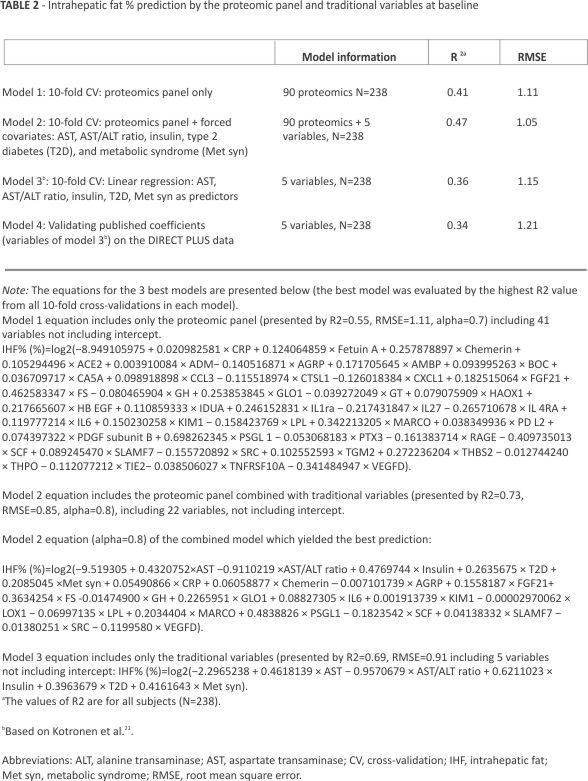
Furthermore, we used the coefficients of the published variables by multivariate linear regression analysis for the prediction of IHF% (model 4) and found that a model trained with the published variables on our data (model 3) had a higher R2 value than the one published previously (0.36 vs. 0.34).
Following the 10-fold cross-validation on the training set, we chose the model with the highest R2 value from all the 10 models created for each model (1, 2, and 3) and presented the equations for the 3 best models in Table 2. A further supplementary sheet shows all the chosen proteins and their coefficients from the 10-fold cross-validation for each elastic net model in Supplemental Table S5, https://links.lww. com/HEP/I364.
Next, we tested and validated the models in Table 2 on different data points from the DIRECT PLUS and CENTRAL trials. The models with the highest R2 value from the 10-fold cross-validation in the training set were used for prediction on the validation sets (best R2 value for model 1: R2=0.55, RMSE=1.11, alpha=0.7; best for model 2: R2=0.73, RMSE=0.85, alpha=0.8; and model 3: R2=0.69, RMSE=0.91).
Extrapolating diabetes and Met syn status for the CENTRAL participants resulted in a sharp decrease in observations; as such, validation of models 2 and 3 on CENTRAL was not possible. We validated model 1 at the baseline timepoint of the CENTRAL trial for the proteomics-only prediction model (model 1), which showed an R2 value of 0.43 (Figure 2A). In addition, we tested models 1, 2, and 3 at the 18-month timepoint of the DIRECT PLUS trial, which showed an R2 value of 0.43 for proteomic-only model (Figure 2B), 0.44 for the traditional markers only (Figure 2C), and 0.53 for the joint model (Figure 2D).

The dynamics of the proteomic panel with IHF
For 39 candidate proteins significantly correlated with IHF% after adjustments for age and sex at the baseline, we calculated the associations between the 18-month change of these proteins and the 18-month change of IHF%. We found 18 proteins significantly associated with IHF% change (FDR <0.05) after adjustments for age and sex, as listed in Figure 3A: 5 proteins related to metabolism, 1 protein related to blood pressure regulation, 2 proteins related to endothelial dysfunction, 3 proteins related to extracellular matrix remodeling, and 7 proteins related to immune function (Figure 3A). After adjustment for age, sex, baseline weight, and weight change, 3 proteins (CA5A, THBS2, and HAOX1) remained significantly associated with IHF% change (p<0.05) (Figure 3B).
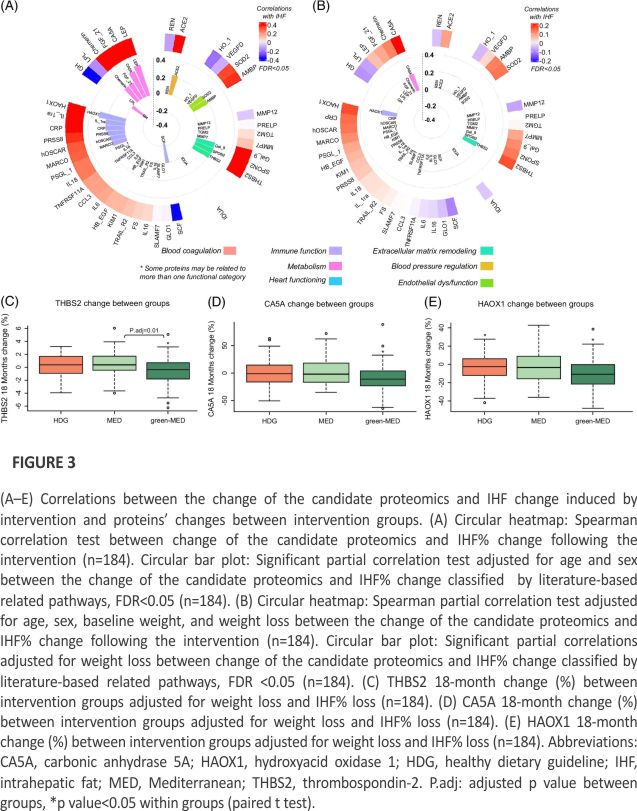
We further investigated CA5A, HAOX1, and THBS2 changes between the 3 intervention groups (HDG, MED, and green-MED). Unadjusted analyses showed significant differences between the green-MED and the MED/HDG groups. For THBS2, green-MED versus MED, p=0.005; green-MED versus HDG, p=0.02; MED versus HDG, p=0.79. For CA5A, green-MED versus MED, p=0.018; green-MED versus HDG, p=0.05; MED versus HDG, p=0.84. For HAOX1, green-MED versus MED, p=0.04; green-MED versus HDG, p=0.04; MED versus HDG, p=0.99.
For all proteins, significant within-group differences were evident for the green-MED group (p<0.05 for all) but not for the MED and HDG groups (p>0.05 for both) for CA5A and THBS2. For HAOX1, significant within-group differences were also evident for the HDG group (p<0.05). Following weight loss and IHF% loss adjustment, a significantly greater decrease was observed for THBS2 in the green-MED group compared to the MED group (p=0.01 between groups) (Figure 3C). No significant change was observed between the MED and HDG groups (p=0.5) and between the green-MED group compared to the HDG group (p=0.1). No statistical differences were found between groups for CA5A (Figure 3D) (green-MED versus MED, p=0.1; green-MED versus HDG, p=0.6; MED versus HDG, p=0.5). No statistical differences were found between groups for HAOX1 (Figure 3E) (green-MED versus MED, p=0.32; green-MED versus HDG, p=0.75; MED versus HDG, p=0.72).
We further explored these proteins by (i) examining the mediation of the proteins for the association between the intervention groups and IHF% change and (ii) assessing the interaction between each protein and the intervention groups in a model predicting 18-month changes in IHF%. No significant results were observed for any of these analyses.
IHF trajectories and proteomic panel differences
Next, we examined the distinct trajectories of IHF% and their proteomic panel (Figure 4A): the normal-IHF% trajectory (n=71), the normal-to-abnormal-IHF% trajectory (n=13), the abnormal-to-normal-IHF% trajectory (n=45), and the abnormal-IHF% trajectory (n=82). We examined the differences in proteomics in each trajectory at the baseline and 18-month timepoints (Figure 4B). Therefore, we conducted PCA analysis (derived from PCA across IHF% trajectories for the baseline and 18 months separately before combining both timepoints to 1 merged dataset) and discovered that the third principal component (PC3) accounted for some of the variability in the proteins (4.905% for baseline and 5.34% for 18 months) and was significantly different between distinct subgroups.
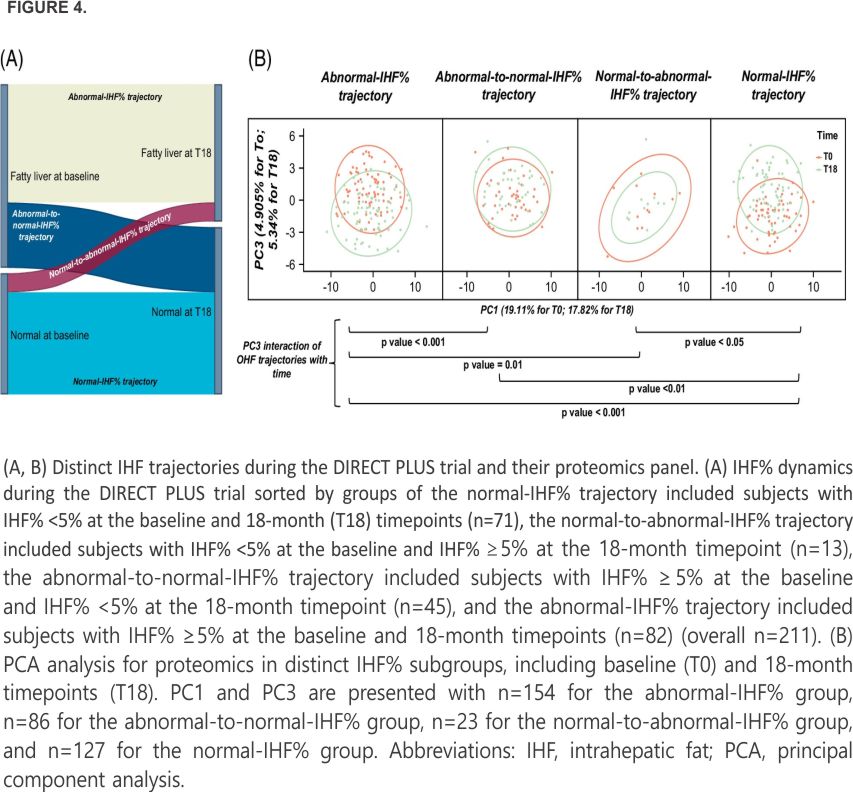
The normal-IHF% trajectory was significantly different from the abnormal-to-normal-IHF% and abnormal-IHF% groups (p<0.001), while the difference was not significant with the normal-to-abnormal-IHF% trajectory (p=0.16). The abnormal-IHF% trajectory differed significantly from the abnormal-to-normal-IHF% (p=0.03) and normal-to-abnormal-IHF% (p=0.002) groups. The normal-to-abnormal-IHF% trajectory was not significantly different from the abnormal-to-normal-IHF% trajectory (p=0.10). The results also suggest that when taking the time interaction with groups into account, the normal-IHF% trajectory was significantly different from abnormal-to-normal-IHF% (p<0.01), abnormal-IHF% groups (p<0.001), and normal-to-abnormal-IHF% trajectory (p<0.05). The abnormal-IHF% trajectory was significantly different from the abnormal-to-normal-IHF% (p<0.001) and normal-to-abnormal-IHF% (p = 0.01) groups. The normal-to-abnormal-IHF% trajectory was not significantly different from the abnormal-to-normal-IHF% trajectory (p=0.61).
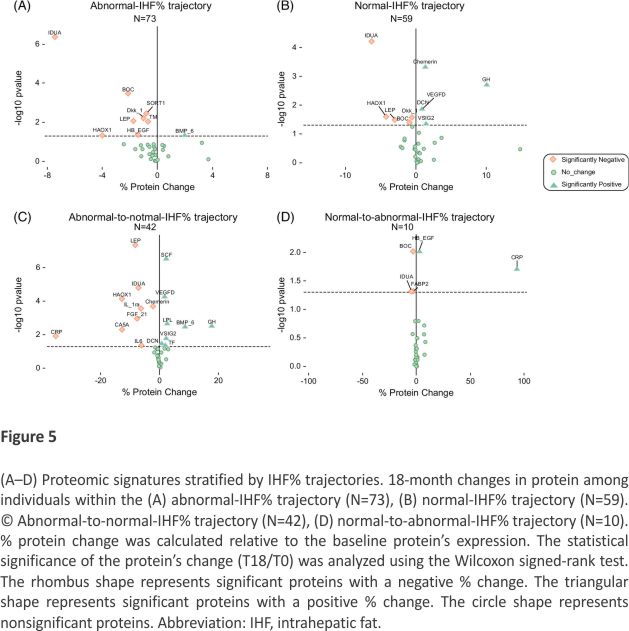
To further distinguish between proteomics changes related to distinct IHF% trajectories, we investigated the 18-month changes in proteins correlated with PC3 (correlation higher than 0.1), as it differed significantly between the IHF% trajectories and found 34 correlated proteomics with the third component. We used a volcano plot to explore from a comprehensive outlook. We focused on the 34 proteins correlated with PC3 and examined whether their 18-month changes would show different patterns among individuals showing different IHF% trajectories. We also assessed the percentage of protein change relative to the baseline protein levels and found that distinct IHF% trajectories differed in their proteomic signatures (Figure 5). PC1, PC2, and PC3 across IHF trajectories were examined in Supplemental Figure S2, https://links. lww.com/HEP/I362. The results showed that only PC3 had significant differences between IHF% trajectories. A post-hoc analysis showed that there are significant differences between the abnormal-IHF% and abnormal-to-normal-IHF% (p=0.02) and between the normal-IHF% and abnormal-to-normal-IHF% trajectories (p=0.02). Results for others were insignificant. We also explored 18-month change analysis across IHF% trajectory groups for each protein (Supplemental Table S6, https://links.lww.com/HEP/I362). Furthermore, proportions of intervention in the distinct IHF% subgroups are elaborated in Supplemental Results S1, https://links.lww.com/HEP/I362.
DISCUSSION
The current study found that the state and the changes in IHF% are associated with distinct proteomic biomarkers in various protein-related pathways. We further demonstrated that these combinations of proteins with traditional variables may enhance IHF% prediction. Also, we showed 3 protein changes: CA5A, HAOX1, and THBS2 that were associated with IHF% change following adjustments for age, sex, weight at baseline, and weight loss, and that THBS2 protein change was greater in the green-MED group, as compared to the MED group following adjustments for weight loss and IHF% loss. Moreover, we found that IHF% trajectory groups differed by protein changes across time, with each trajectory involving various proteins. Our findings suggest novel proteomic signatures that may indicate MRI-assessed IHF state and changes during lifestyle intervention.
This study has several limitations, including the high proportion of men participating, which limits our ability to extrapolate our results to women. Participants were abdominally obese or had dyslipidemia, with a high proportion of NAFLD at the baseline, which further limits generalizability. Also, a direct causal effect of the change in proteomics on IHF% and vice versa cannot be assessed; only the causal effects of the dietary interventions. Furthermore, for simplification, the literature-based classifications of proteins distinguish each protein into 1 related pathway and do not represent all related pathways; in practice, each protein may be involved in multiple pathways. The strengths of this study include a high degree of compliance with the trial intervention, a relatively large sample size, and long-term intervention. We used an accurate imaging technique for IHF% quantification,32 which allowed us both continuous measurement and distinct trajectory group stratification of IHF%.
Our study explored various proteins correlated with IHF% at baseline after adjustments for age, sex, and weight. We revealed that most proteins were related to immune function pathways, with others related to extracellular matrix remodelling, metabolism, endothelial dysfunction, blood pressure regulation, blood coagulation, and heart functioning pathways. However, related pathways should be interpreted with caution due to the typical involvement of most proteins in several pathways in parallel. Some of the proteins were novel biomarkers to our knowledge about their association with IHF% (eg, SCF, HAOX1, and PRELP). We also validated other proteins previously found to be associated with IHF% (eg, high-sensitivity C-reactive protein33 and Chemerin34). In addition, we showed that the change in 3 proteins was directly correlated with IHF% change: CA5, THBS2, and HAOX1. Some varieties of carbonic anhydrases (Cas), which regulate acid-base balance,35 were associated with the development of NAFLD.36 CA5 is expressed in mitochondria and is involved in various metabolic pathways, including the urea cycle, gluconeogenesis, and insulin secretion. 35,37 CA5A, a specific isozyme of CA5, is distributed in the liver and was identified as a potential target for treating NAFLD and NASH in a metabolite-target-disease network analysis.36 Here, we show that the change of CA5 positively correlated with the change of IHF% following the 18-month lifestyle intervention, following adjustments for age and sex; this association persisted after further adjustment for weight at baseline and weight loss. THBS2, a protein involved in cell-extracellular matrix interactions, is a possible predictor of NAFLD severity.38–40 We found that the change of THBS2 positively correlated with the change of IHF% following adjustments for age and sex, and beyond baseline weight and weight loss as well. HAOX1 is a peroxisomal liver enzyme. HAOX1 negatively regulates the inflammatory response of liver macrophages in alcoholic liver disease through the NF-kB pathway, and the role of NF-kB in chronic liver diseases such as steatohepatitis, fibrosis, and cancer has been widely reported.41 Here we found that HAOX1 change is positively associated with the change of IHF% after adjustments for age, sex, and further baseline weight and weight loss.
Further analyses adjusted for weight loss and IHF% loss showed that CA5A and HAOX1 protein change did not differ between intervention groups, suggesting a possible role of weight and IHF% on these proteins. In addition, the change of THBS2 protein was significantly higher in the green-MED group than in the MED group following 18 months of intervention. This may indicate that the green-MED diet had an impact on THBS2 protein levels beyond weight loss and IHF% loss. These results may encourage further exploration of potential mechanisms by which IHF% changes, and specifically, how the green-MED diet might induce this change through the THBS2 protein.
While the cost factor of MRI versus blood metabolic panels and proteomics assays might be a consideration, it is important to note that a comprehensive understanding of IHF% changes requires a multifaceted approach. While liver MRI assesses the IHF% percentage, it does not offer insights into the underlying metabolic processes. Proteomics and metabolomics provide a robust framework as metabolite concentrations are directly regulated by proteins and enzymes in their metabolic pathways. Thus, using protein markers may enhance our ability to explore and predict pathophysiology and mechanistic pathways in a more holistic manner. It is important to acknowledge that using cardiometabolic proteins may introduce a broader spectrum of information beyond IHF%-specific markers. In this study, we also used known traditional markers linked to IHF% to explore broader markers, including more specific ones. Prediction models incorporating proteomics alongside traditional measures could provide a more comprehensive assessment, especially in scenarios where frequent MRIs might not be feasible. Furthermore, the recognition of novel omics biomarkers is expanding as the interest in precision nutrition strategies rises, with the encouragement of omics combinations for diagnostic performance improvement.17,23,24 Thus, exploring proteomic biomarkers may help find new markers, which, combined with existing clinical measurements, could improve the prediction of IHF%. A previous publication42 created a serum protein diagnostic model for NAFLD composed of 20 protein peaks, with a sensitivity of 89% and a specificity of 83%. One recent study27 used serum protein scanning to identify signatures corresponding to the key components of liver biopsy in NAFLD and could also detect changes induced by therapeutic interventions. Additional studies showed that proteome profiling holds great potential in generating novel insights into disease mechanisms and discovering new biomarkers for different stages in NAFLD.3,25,26
In this study, we combined variables from the previously published liver fat percentage prediction model21 with our proteomic panel to examine whether combining proteomics with traditional variables (aspartate transaminase, aspartate transaminase/alanine transaminase ratio, fasting insulin levels, and the presence of T2D and Met syn) would improve the prediction of IHF%. Those variables were previously found to be associated with NAFLD.43–45 Furthermore, Met syn and T2D are closely related comorbidities associated with NAFLD,13,14, which are also evident in the recent dispute regarding renaming NAFLD into metabolic-associated fatty liver disease. 46 We found that the combined model yielded the best prediction as the addition of omics, specifically proteomics, increased the performance of the predictive models.
The PCA analysis of the protein panel suggests that the third principal component plays a role in the difference between groups with distinct IHF% trajectories while considering the interaction with time, though the power is limited. Further exploration of the proteomics correlated with PC3 revealed several combinations of proteins that might change differently in each IHF% trajectory. For instance, while IDUA significant protein change was consistently involved in all IHF% trajectories, several other proteins’ significant change presence changed by different trajectories (eg, BOC, LEP, and Chemerin). In addition, this exploratory analysis enables a comprehensive outlook on a set of proteins simultaneously. For example, the abnormal IHF% trajectory includes significant 18-month changes in IDUA, BOC, HAOX1, LEP, SORT1, DKK_1, TM, HB_EGF, and BMP_6 while the normal-IHF% trajectory includes IDUA, BOC, HAOX1, LEP, DKK_1, Chemerin, GH, VEGFD, DCN, and VSIG2. Thus, we show that IDUA, BOC, HAOX1, LEP, and DKK_1 overlap between both trajectories, but there is a difference in the other mentioned proteins for each IHF% trajectory. This might imply that a portion of the proteomic panel change is linked with the trajectory of IHF%, indicating there might be a specific signature for different IHF% trajectories. However, the results for the normal-to-abnormal-IHF% trajectory should be interpreted with caution due to the low number of observations entered in the analysis.
By uncovering the relationship between IHF% and specific proteomic biomarkers, we pave the way for several practical benefits. First, we showed that integrating proteomic biomarkers with traditional variables offers the potential for improved prediction of IHF% in our study. This result may benefit along with other integrated prediction tools for future advancements in generating more accurate and noninvasive IHF% and NAFLD monitoring tools. Second, identifying specific proteins associated with IHF% changes offers the prospect of developing biomarker-based monitoring strategies which could assist in regular patient assessments, provide early indications of IHF% alterations, and enable timely adjustments in treatment plans. Third, discovering proteins such as CA5A, HAOX1, and THBS2 associated with IHF% changes suggests potential therapeutic targets. These markers could be explored further to develop novel therapeutic interventions targeting IHF% regulation. Lastly, understanding the relationship between IHF% trajectories and distinct protein changes will possibly allow for personalized treatment approaches, which may enable clinicians to develop targeted interventions and therapies specific to an individual’s response.
In conclusion, our findings enhance our understanding of the interplay between IHF% and proteomic biomarkers. Combining proteomics with traditional variables may yield a better prediction of IHF%, and distinct IHF% trajectories may differ in their proteomic signatures. The discovery of these markers improves patient monitoring, the detection of novel therapeutic mediators, personalized treatment approaches, and prognosis.
DATA AVAILABILITY STATEMENT
All data generated or analyzed during this study are included in this published article (and its supplementary information files).
AUTHOR CONTRIBUTIONS
Iris Shai conceptualized the DIRECT PLUS. Anat Yaskolka Meir, Ehud Rinott, Gal Tsaban, Hila Zelicha, and Alon Kaplan performed the data collection. Dana T. Goldberg and Anat Yaskolka Meir performed the statistical analysis, reviewed the literature, and drafted the manuscript. Anat Yaskolka Meir, Ehud Rinott, Gal Tsaban, Hila Zelicha, Alon Kaplan, Philip Rosen, and Ilan Shelef supervised the MRI acquisition. Anat Yaskolka Meir and Philip Rosen quantified the liver fat percentage. Nora Klöting performed the proteomic measurements. Uta Ceglarek and Berend Iserman performed laboratory analyses. All authors contributed to the interpretation of data and reviewed this work’s language and intellectual content. Dana T. Goldberg, Anat Yaskolka Meir, Ohad Etzion, Meir J. Stampfer, Matthias Blüher, Frank B. Hu, Meir J. Stampfer, and Iris Shai revised the final draft of the study and approved the final version.
ACKNOWLEDGMENTS
The authors thank the DIRECT PLUS participants for their valuable contributions. They also thank Efrat Pupkin, Eyal Goshen, Avi Ben Shabat, and Evyatar Cohen from the Nuclear Research Center Negev for their valuable contributions to this study.
FUNDING INFORMATION
This work was supported by grants from the German Research Foundation (DFG) (German Research Foundation —project number 209933838—SFB 1052; B11), Israel Ministry of Health grant 87472511 (to Iris Shai); Israel Ministry of Science and Technology grant 3-13604 (to Iris Shai); and the California Walnuts Commission (to Iris Shai). Anat Yaskolka Meir is supported by the Council for Higher Education —Zuckerman support program for outstanding postdoctoral female researchers. This information, content, and conclusions are those of the authors and should not be construed as the official position or policy of, nor should any endorsements be inferred by the funding agencies.
CONFLICTS OF INTEREST
Uta Ceglarek received grants from Roche. Matthias Blüher consults, advises and is on the speakers’ bureau for Lilly. He consults and is on the speakers’ bureau for Amgen, Boehringer-Ingelheim, Novo Nordisk, and Sanofi. He is on the speakers’ bureau for AstraZeneca, Bayer, and Novartis. The remaining authors have no conflicts to report.
ETHICS APPROVAL AND CONSENT TO PARTICIPATE
The study was conducted by the Declaration of Helsinki, and the protocol was approved by the Medical Ethics Board and Institutional Review Board at Soroka University Medical Centre, Be’er Sheva, Israel (SOR-0280-16). Participants provided written informed consent and received no compensation.
Author Information
1. The Health & Nutrition Innovative International Research Center, Department of Epidemiology, Biostatistics and Community Health Sciences, Faculty of Health Sciences, School of Public Health, Ben-Gurion University of the Negev, Beer-Sheva, Israel
2. Department of Epidemiology, Harvard T.H. Chan School of Public Health, Boston, MA, USA
3. Department of Medicine, University of Leipzig, Leipzig, Germany
4. Institute of Laboratory Medicine, Clinical Chemistry, and Molecular Diagnostics, University of Leipzig Medical Center, Leipzig, Germany
5. Department of Diagnostic Imaging, Soroka University Medical Center, Ben-Gurion University of the Negev, Beer-Sheva, Israel
6. Helmholtz Institute for Metabolic, Obesity and Vascular Research (HI-MAG) of the Helmholtz Zentrum München at the University of Leipzig and University Hospital Leipzig, Leipzig, Germany
7. Department of Gastroenterology and Liver Diseases, Soroka University Medical Center, Beersheba, Israel
8. Department of Nutrition, Harvard T.H. Chan School of Public Health, Boston, MA, USA
9. Department of Medicine, Channing Division of Network Medicine, Brigham and Women’s Hospital and Harvard Medical School, Boston, MA, USA
Abbreviations:
CA5A, carbonic anhydrase 5A; CV, coefficient of variance; FDR, false discovery rate; green-MED, green-Mediterranean; HAOX1, hydroxyacid oxidase 1; HbA1c, hemoglobin A1; HDG, healthy dietary guidelines; IHF%, intrahepatic fat; MED, Mediterranean; Met syn, metabolic syndrome; PCA, principal component analysis; RMSE, root mean square error; T2D, type 2 diabetes; THBS2, thrombospondin-2.
Dana T. Goldberg and Anat Yaskolka Meir contributed equally.
Correspondence
Iris Shai, The Health & Nutrition Innovative International Research Center, Department of Epidemiology, Biostatistics and Community Health Sciences, Faculty of Health Sciences, School of Public Health, Ben-Gurion University of the Negev, P.O. Box 653, Be’er Sheva 84105, Israel. Email: irish @bgu.ac.il
REFERENCES
1. Emilsson V, Ilkov M, Lamb JR, Finkel N, Gudmundsson EF, Pitts R, et al. Co-regulatory networks of human serum proteins link genetics to disease. Science. 2018;361:769– 773.
2. Williams SA, Kivimaki M, Langenberg C, Hingorani AD, Casas JP, Bouchard C, et al. Plasma protein patterns as comprehensive indicators of health. Nat Med. 2019;25:1851-1857.
3. Niu L, Geyer PE, Wewer Albrechtsen NJ, Gluud LL, Santos A, Doll S, et al. Plasma proteome profiling discovers novel proteins associated with non-alcoholic fatty liver disease. Mol Syst Biol. 2019;15: e8793.
4. Le MH, Yeo YH, Li X, Li J, Zou B, Wu Y, et al. 2019 Global NAFLD prevalence: A systematic review and meta-analysis. Clin Gastroenterol Hepatol. 2022;20: 2809–2817.e28.
5. Wong VWS, Wong GLH, Choi PCL, Chan AWH, Li MKP, Chan HY, et al. Disease progression of non-alcoholic fatty liver disease: A prospective study with paired liver biopsies at 3 years. Gut. 2010;59: 969–74.
6. McPherson S, Hardy T, Henderson E, Burt AD, Day CP, Anstee QM. Evidence of NAFLD progression from steatosis to fibrosing-steatohepatitis using paired biopsies: Implications for prognosis and clinical management. J Hepatol. 2015;62:1148–55.
7. Chalasani N, Younossi Z, Lavine JE, Charlton M, Cusi K, Rinella M, et al. The diagnosis and management of nonalcoholic fatty liver disease: Practice guidance from the American Association for the Study of Liver Diseases. Hepatology. 2018;67: 328–357.
8. Mantovani A, Csermely A, Petracca G, Beatrice G, Corey KE, Simon TG, et al. Non-alcoholic fatty liver disease and risk of fatal and non-fatal cardiovascular events: An updated systematic review and meta-analysis. Lancet Gastroenterol Hepatol. 2021;6:903– 913.
9. Chen Z-F, Dong X-L, Huang Q-K, Hong WD, Wu WZ, Wu JS, et al. The combined effect of non-alcoholic fatty liver disease and metabolic syndrome on colorectal carcinoma mortality: A retrospective study in Chinese females. World J Surg Oncol. 2018; 16:1–8.
10. Wu K, Zhai MZ, Weltzien EK, Cespedes Feliciano EM, Meyerhardt JA, Giovannucci E, et al. Non-alcoholic fatty liver disease and colorectal cancer survival. Cancer Causes Control. 2019;30:165–168.
11. Targher G, Byrne CD. Non-alcoholic fatty liver disease: An emerging driving force in chronic kidney disease. Nat Rev Nephrol. 2017; 13:297–310.
12. Simon TG, Roelstraete B, Hagström H, Sundström J, Ludvigsson JF. Non-alcoholic fatty liver disease and incident major adverse cardiovascular events: Results from a nationwide histology cohort. Gut. 2022;71: 1867 –1875.
13. Yki-Järvinen H. Non-alcoholic fatty liver disease as a cause and a consequence of metabolic syndrome. Lancet Diabetes Endocrinol. 2014; 2:901–10.
14. Stefan N, Cusi K. A global view of the interplay between non-alcoholic fatty liver disease and diabetes. Lancet Diabetes Endocrinol. 2022; 10:284–296.
15. Han H, Jiang Y, Wang M, Melaku M, Liu L, Zhao Y, et al. Intestinal dysbiosis in nonalcoholic fatty liver disease (NAFLD): Focusing on the gut–liver axis. Crit Rev Food Sci Nutr. 2023; 63:1689–1706.
16. Yaskolka Meir A, Rinott E, Tsaban G, Zelicha H, Kaplan A, Rosen P, et al. Effect of green-Mediterranean diet on intrahepatic fat: The DIRECT PLUS randomised controlled trial. Gut. 2021;70:2085–2095.
17. Loomba R, Adams LA. Advances in non-invasive assessment of hepatic fibrosis. Gut. 2020;69:1343–1352.
18. Segura-Azuara NÁ, Varela-Chinchilla CD, Trinidad-Calderón PA. MAFLD /NAFLD biopsy-free scoring systems for hepatic steatosis, NASH, and fibrosis diagnosis. Front Med (Lausanne). 2021;8:774079.
19. Drescher H, Weiskirchen S, Weiskirchen R. Current status in testing for nonalcoholic fatty liver disease (NAFLD) and nonalcoholic steatohepatitis (NASH. Cells. 2019; 8:845.
20. Ruiz-Tovar J, Zubiaga L. Validation of biochemical scores for liver steatosis before and 1 year after sleeve gastrectomy. Surg Obes Relat Dis. 2019; 15:1447-1453.
21. Kotronen A, Peltonen M, Hakkarainen A, Sevastianova K, Bergholm R, Johansson LM, et al. Prediction of non-alcoholic fatty liver disease and liver fat using metabolic and genetic factors. Gastroenterology. 2009;137: 865–72.
22. Rodriguez LA, Shiboski SC, Bradshaw PT, Fernandez A, Herrington D, Ding J, et al. Predicting non-alcoholic fatty liver disease for adults using practical clinical measures: Evidence from the multi-ethnic study of atherosclerosis. J Gen Intern Med. 2021;36:2648 2655.
23. Di Mauro S, Scamporrino A, Filippello A, Di Pino A, Scicali R, Malaguarnera R, et al. Clinical and molecular biomarkers for diagnosis and staging of NAFLD. Int J Mol Sci. 2021;22: 11905.
24. Dorairaj V, Sulaiman SA, Abu N, Abdul Murad NA. Nonalcoholic fatty liver disease (NAFLD): Pathogenesis and noninvasive diagnosis. Biomedicines. 2021; 10:15.
25. Wood GC, Chu X, Argyropoulos G, Benotti P, Rolston D, Mirshahi T, et al. A multi-component classifier for nonalcoholic fatty liver disease (NAFLD) based on genomic, proteomic, and phenomic data domains. Sci Rep. 2017;7:43238.
26. Sveinbjornsson G, Ulfarsson MO, Thorolfsdottir RB, Jonsson BA, Einarsson E, Gunnlaugsson G, et al. Multiomics study of nonalcoholic fatty liver disease. Nat Genet. 2022;54: 1652–1663.
27. Sanyal AJ, Williams SA, Lavine JE, Neuschwander-Tetri BA, Alexander L, Ostroff R, et al. Defining the serum proteomic signature of hepatic steatosis, inflammation, ballooning and fibrosis in non-alcoholic fatty liver disease. J Hepatol. 2023;78:693 –703.
28. Lundberg M, Eriksson A, Tran B, Assarsson E, Fredriksson S. Homogeneous antibody-based proximity extension assays provide sensitive and specific detection of low-abundant proteins in human blood. Nucleic Acids Res. 2011; 39:e102.
29. Gepner Y, Shelef I, Schwarzfuchs D, Zelicha H, Tene L, Yaskolka Meir A, et al. Effect of distinct lifestyle interventions on mobilization of fat storage pools: CENTRAL magnetic resonance imaging randomized controlled trial. Circulation. 2018; 137:1143–1157.
30. Gepner Y, Shelef I, Komy O, Cohen N, Schwarzfuchs D, Bril N, et al. The beneficial effects of the Mediterranean diet over the low-fat diet may be mediated by decreasing hepatic fat content. J Hepatol. 2019;71:379 –388.
31. Huang PL. A comprehensive definition for metabolic syndrome. Dis Model Mech. 2009;2:231–7.
32. Hu HH, Kim HW, Nayak KS, Goran MI. Comparison of fat-water MRI and single-voxel MRS in the assessment of hepatic and pancreatic fat fractions in humans. Obesity (Silver Spring). 2010;18:841–7.
33. Fricker ZP, Pedley A, Massaro JM, Vasan RS, Hoffmann U, Benjamin EJ, et al. Liver fat is associated with markers of inflammation and oxidative stress in the analysis of data from the Framingham Heart Study. Clin Gastroenterol Hepatol. 2019; 17:1157–1164. e4.
34. Ren Q, Wang H, Zeng Y, Fang X, Wang M, Li D, et al. Circulating chemerin levels in metabolic-associated fatty liver disease: A systematic review and meta-analysis. Lipids Health Dis. 2022; 21:1–13.
35. Parkkila AK, Scarim AL, Parkkila S, Waheed A, Corbett JA, Sly WS. Expression of carbonic anhydrase V in pancreatic beta cells suggests a role for mitochondrial carbonic anhydrase in insulin secretion. J Biol Chem. 1998;273:24620–3.
36. Ren S, Zhang Q, Jiang M, Chen M, Xu X, Wang D, et al. Systematic characterization of the metabolites of defatted walnut powder extract in vivo and screening of the mechanisms against NAFLD by UPLC-Q-Exactive Orbitrap MS combined with network pharmacology. J Ethnopharmacol. 2022;285:114870.
37. Aspatwar A, Supuran CT, Waheed A, Sly WS, Parkkila S. Mitochondrial carbonic anhydrase VA and VB: Properties and roles in health and disease. J Physiol. 2023;601:257–274.
38. Calabro NE, Kristofik NJ, Kyriakides TR. Thrombospondin-2 and extracellular matrix assembly. Biochim Biophys Acta Aug. 2014; 1840:2396–402.
39. Wu X, Cheung CKY, Ye D, Chakrabarti S, Mahajan H, Yan S, et al. Serum thrombospondin-2 levels are closely associated with the severity of metabolic syndrome and metabolic-associated fatty liver disease. J Clin Endocrinol Metab, 107 2022:e3230 –e3240.
40. Kimura T, Tanaka N, Fujimori N, Yamazaki T, Katsuyama T, Iwashita Y, et al. Serum thrombospondin 2 is a novel predictor of the severity in patients with NAFLD. Liver Int. 2021; 41:505–514.
41. Chen H, Li X, Sun Y, Du Y, Wu S, Wu Y, et al. HAO1 negatively regulates liver macrophage activation via the NF-κB pathway in alcohol-associated liver disease. Cell Signal. 2022;99:110436.
42. Yu C, Xu C, Xu L, Yu J, Miao M, Li Y. Serum proteomic analysis revealed diagnostic value of haemoglobin for nonalcoholic fatty liver disease. J Hepatol. 2012;56:241–247.
43. Yu AS, Keeffe EB. Elevated AST or ALT to nonalcoholic fatty liver disease: Accurate predictor of disease prevalence? Am J Gastroenterol. 2003; 98:955.
44. Sorbi D, Boynton J, Lindor KD. The ratio of aspartate aminotransferase to alanine aminotransferase: Potential value in differentiating nonalcoholic steatohepatitis from alcoholic liver disease. Am J Gastroenterol. 19:1018 –22 9499.
45. Korenblat KM, Fabbrini E, Mohammed BS, Klein S. Liver, muscle, and adipose tissue insulin action is directly related to intrahepatic triglyceride content in obese subjects. Gastroenterology 2008; 134:134 1369–75.
46. Eslam M, Sanyal AJ, George J, Sanyal A, Neuschwander-Tetri B, Tiribelli C, et al. MAFLD: A consensus-driven proposed nomenclature for metabolic-associated fatty liver disease. Gastroenterology. 2020;158: 1999 –2014. e1.
CREDITS: Goldberg DT, Yaskolka Meir A, Tsaban G, Rinott E, Kaplan A, Zelicha H, Klöting N, Ceglarek U, Iserman B, Shelef I, Rosen P, Blüher M, Stumvoll M, Etzion O, Stampfer MJ, Hu FB, Shai I. Novel proteomic signatures may indicate MRI-assessed intrahepatic fat state and changes: The DIRECT PLUS clinical trial. Hepatology. 2025 Jan 1;81(1):198-211. doi: 10.1097/HEP.0000000000000867. Epub 2024 Mar 27. PMID: 38537153; PMCID: PMC11643130.