

Bethany Warren,1 Casey M. Rebholz,1 Yingying Sang,1 Alexandra K. Lee,1 Josef Coresh,1,2 Elizabeth Selvin,1,2 and Morgan E. Grams1,2
1Department of Epidemiology and the Welch Center for Prevention, Epidemiology and Clinical Research, Johns Hopkins Bloomberg
School of Public Health, Baltimore, MD
2Johns Hopkins University School of Medicine, Baltimore, MD
Corresponding author: Morgan E. Grams,mgrams2@jhmi.edu.
OBJECTIVE
To characterize long-term kidney disease trajectories in persons with and without diabetes in a general population.
RESEARCH DESIGN AND METHODS
We classified 15,517 participants in the community-based Atherosclerosis Risk in Communities (ARIC) study by diabetes status at baseline (1987–1989; no diabetes, undiagnosed diabetes, and diagnosed diabetes). We used linear mixed models with random intercepts and slopes to quantify estimated glomerular filtration rate (eGFR) trajectories at four visits over 26 years.
RESULTS
Adjusted mean eGFR decline over the full study period among participants without diabetes was -1.4 mL/min/1.7 3m2/year (95% CI -1.5 to -1.4), with undiagnosed diabetes was -1.8 mL/min /1.73 m2/year (95% CI -2.0 to -1.7) (difference vs. no diabetes, P < 0.001), and with diagnosed diabetes was -2.5 mL/min/1.73 m2/year (95% CI -2.6 to -2.4) (difference vs. no diabetes, P < 0.001). Among participants with diagnosed diabetes, risk factors for steeper eGFR decline included African American race, APOL1 high-risk genotype, systolic blood pressure ≥140 mmHg, insulin use, and higher HbA1c.
CONCLUSIONS
Diabetes is an important risk factor for kidney function decline. Those with diagnosed diabetes declined almost twice as rapidly as those without diabetes. Among people with diagnosed diabetes, steeper declines were seen in those with modifiable risk factors, including hypertension and glycemic control, suggesting areas for continued targeting in kidney disease prevention.
Diabetes is increasingly prevalent worldwide wide 1,2 and is associated with high mortality and morbidity, including adverse kidney events. Diabetes is among the strongest common risk factors for end-stage renal disease, and in industrialized countries, diabetes contributes to -50% of cases 3. Less is known about the pattern of kidney function decline associated with diabetes that precedes end-stage renal disease. Identifying patterns of estimated glomerular filtration rate (eGFR) decline could inform monitoring practices for people at high risk of chronic kidney disease (CKD) progression. A better understanding of when and in whom eGFR decline occurs would be useful for the design of clinical trials because eGFR decline >30% is now often used as a surrogate endpoint for CKD progression 4. Trajectories among persons with diabetes are of particular interest because of the possibility for early intervention and the prevention of CKD development. However, eGFR trajectories among persons with new diabetes may be complex due to the hypothesized period of hyperfiltration by which GFR increases, followed by progressive, rapid decline 5.
Using data from the Atherosclerosis Risk in Communities (ARIC) study, an ongoing prospective community-based cohort of >15,000 participants initiated in 1987 with serial measurements of creatinine over 26 years, our aim was to characterize patterns of eGFR decline associated with diabetes, identify demographic, genetic, and modifiable risk factors within the population with diabetes that was associated with steeper eGFR decline, and assess for evidence of early hyperfiltration.
RESEARCH DESIGN AND METHODS
Study Population
The ARIC study comprises 15,792 participants from four U.S. communities (Forsyth County, NC; Jackson, MS; suburban Minneapolis, MN; and Washington County, MD) (6). Six study visits have been completed to date. We included data from the four visits with creatinine measurements (visit 1, 1987–1989 [serum]; visit 2, 1990–1992 [serum]; visit 4, 1996–1998 [plasma]; and visit 5, 2011–2013 [serum]). Institutional review boards at each site approved the study, and all participants provided informed consent.
Of the 15,792 participants who attended the first visit, we excluded those who had eGFR ≤15 mL/min/1.73 m2 or end-stage renal disease at baseline (visit 1; n = 25), those who were not black or white race or who were black from the Minnesota or Maryland sites due to small sample size (n = 103), and those missing eGFR measurements (n = 147), resulting in 15,517 participants in our study population.
Diabetes Assessment
Diabetes status was assessed at baseline (visit 1) and categorized as no diabetes, undiagnosed diabetes, and diagnosed diabetes. Undiagnosed diabetes was defined as a fasting glucose ≥126 mg/dL or non-fasting glucose ≥200 mg/dL without medication or physician diagnosis. Diagnosed diabetes was defined as a self-report of physician diagnosis or use of glucose-lowering medication.
Kidney Function Estimation
Creatinine measurements were calibrated across study visits to minimize methodological differences and converted to eGFR using the Chronic Kidney Disease Epidemiology Collaboration equation 7,8. End-stage renal disease was defined as the identification of incident disease by records of renal replacement therapy (dialysis or transplant) from the U.S. Renal Data System (USRDS) during follow-up 9. For our analysis, participants were assigned an eGFR of 15mL/min/ 1.73 m2 at the onset of end-stage renal disease and then censored, meaning subsequent visit-based eGFR values were not included.
Covariate Assessment
Age, sex, race, history of coronary heart disease, smoking status, annual family income, education status, and use of hypertension and diabetes medications were self-reported 10. Systolic blood pressure was measured three times using a random zero sphygmomanometer with the participant in the resting state. The second and third measurements were then averaged to obtain one value 11. Height and weight were measured with standard protocols, and the measurements were used to calculate BMI (weight in kilograms divided by the square of height in meters) 10.
APOL1 risk status, haemoglobin A1c (HbA1c), and 1,5-anhydroglucitol were examined among those with diagnosed diabetes. APOL1 risk status, which has been demonstrated to be associated with CKD progression 12,13, was assessed in African Americans who provided consent for DNA testing at visit 1 per methods described previously 13. We imputed APOL1 risk status as low risk for white participants and characterized black participants as APOL1 low risk or APOL1 high risk based on the number of risk alleles. HbA1c, a marker of glycemic control and diabetes severity among those with diabetes, was measured in visit 2 whole-blood samples using the Tosoh A1c 2.2 and Tosoh G7 (Tosoh Bioscience) 14, methods certified by the National Glycohemoglobin Standardization Program and aligned to the Diabetes Control and Complications Trial (DCCT). 1,5-Anhydroglucitol (GlycoMark assay; GlycoMark Corporation), a novel biomarker that reflects hyperglycemic excursions and may be associated with kidney disease progression 15, was measured in visit 2 serum samples using the Modular P800 Chemistry Analyzer (Roche Diagnostics). For additional details on study design and timing of measurements, see Supplementary Fig. 1.
Statistical Analysis
We categorized people into groups of no diabetes, undiagnosed diabetes, and diagnosed diabetes at baseline (visit 1) and compared baseline clinical characteristics using ANOVA for continuous variables and Pearson X2 tests for categorical variables. We generated a scatterplot of eGFR and age across visits by diabetes status at baseline using locally weighted scatterplot smoothing to find a curve of best fit for each diabetes group. To estimate individual eGFR slopes over time, we used linear mixed-effects models with random intercepts and random slopes. These models were fit diabetes status at baseline as a nominal variable to adjust the baseline level of eGFR and included an interaction term between diabetes status at baseline and time to estimate the annual decline in eGFR by diabetes categories. Linear mixed models were run unadjusted and adjusted, with the latter model including following diabetes and kidney disease-related risk factors: age, sex, race–centre, BMI, systolic blood pressure, hypertension medication use, HDL, prevalent coronary heart disease, annual family income, education status, and smoking status, as well as each variable interacted with time. Continuous covariates were centred at the analytic population mean. We tested model assumptions and considered different covariance structures, comparing nested models using Akaike information criteria. We identified the unstructured covariance model as the most optimal and conservative approach. From the mixed models, we described the overall mean annual decline by diabetes status at baseline and used the random effects to estimate best linear unbiased predictions to describe the distributions of yearly slopes in eGFR by diabetes status at baseline and displayed them using kernel density plots.
Because of substantial variation in annual eGFR slope among people with diagnosed diabetes, we sought to identify risk factors that were associated with faster decline. Among those with diagnosed diabetes, we compared unadjusted and adjusted mean annual decline in eGFR by race–APOL1 risk status (white, black–APOL1 low risk, and black– APOL1 high risk), systolic blood pressure (<140 and ≥140 mmHg), smoking status (never, former, and current), prevalent coronary heart disease (no prevalent coronary heart disease and prevalent coronary heart disease), diabetes medication use (no medication use, oral medication use only [sulfonylureas], and any insulin use), HbA1c (<7% [<53 mmol/ mol], ≥7 and <9% [≥53 and <75 mmol/ mol], and ≥9% [≥75 mmol/mol]), and 1,5-anhydroglucitol (≥10 and <10 mg/ mL). Because some of these variables were only available at visit 2, we required that participants included in this subgroup analysis attend both visits 1 and 2 and not be missing information on APOL1 or the variables assessed at visit 2 to ensure a consistent sample size. In addition to diabetes and kidney disease-related risk factors in the adjusted model, we also included diabetes medication use and HbA1c to account for diabetes severity in these analyses.
Next, to explore potential hyper- filtration, we used a linear spline model to allow the slope to change for each diabetes category between the first 3 years of follow-up (visit 1 to visit 2) and the subsequent time period (visit 2 to visit 5). We reported the unadjusted and adjusted distributions of annual eGFR slopes by diabetes status (assessed at baseline) from visit 1 to visit 2 and visit 2 to visit 5.
To test the robustness of our results, we conducted a sensitivity analysis in which we did not assign eGFR values of 15mL/min/1.73 m2 in those who developed the end-stage renal disease. All analyses were conducted in Stata 13 (StataCorp, College Station, TX).
RESULTS
Study Population Characteristics
There were 15,517 participants included in the analysis: 13,698 (88%) without diabetes, 634 (4%) with undiagnosed diabetes, and 1,185 (8%) with diagnosed diabetes at baseline. There were 47,695 total eGFR measurements, with three or more measurements per person among 76% of participants (78% among those with no diabetes, 67% among undiagnosed diabetes, and 58% among diagnosed diabetes), and 375 cases of end-stage renal disease during follow-up (188 among those with no diabetes, 38 among undiagnosed diabetes, and 149 among diagnosed diabetes).
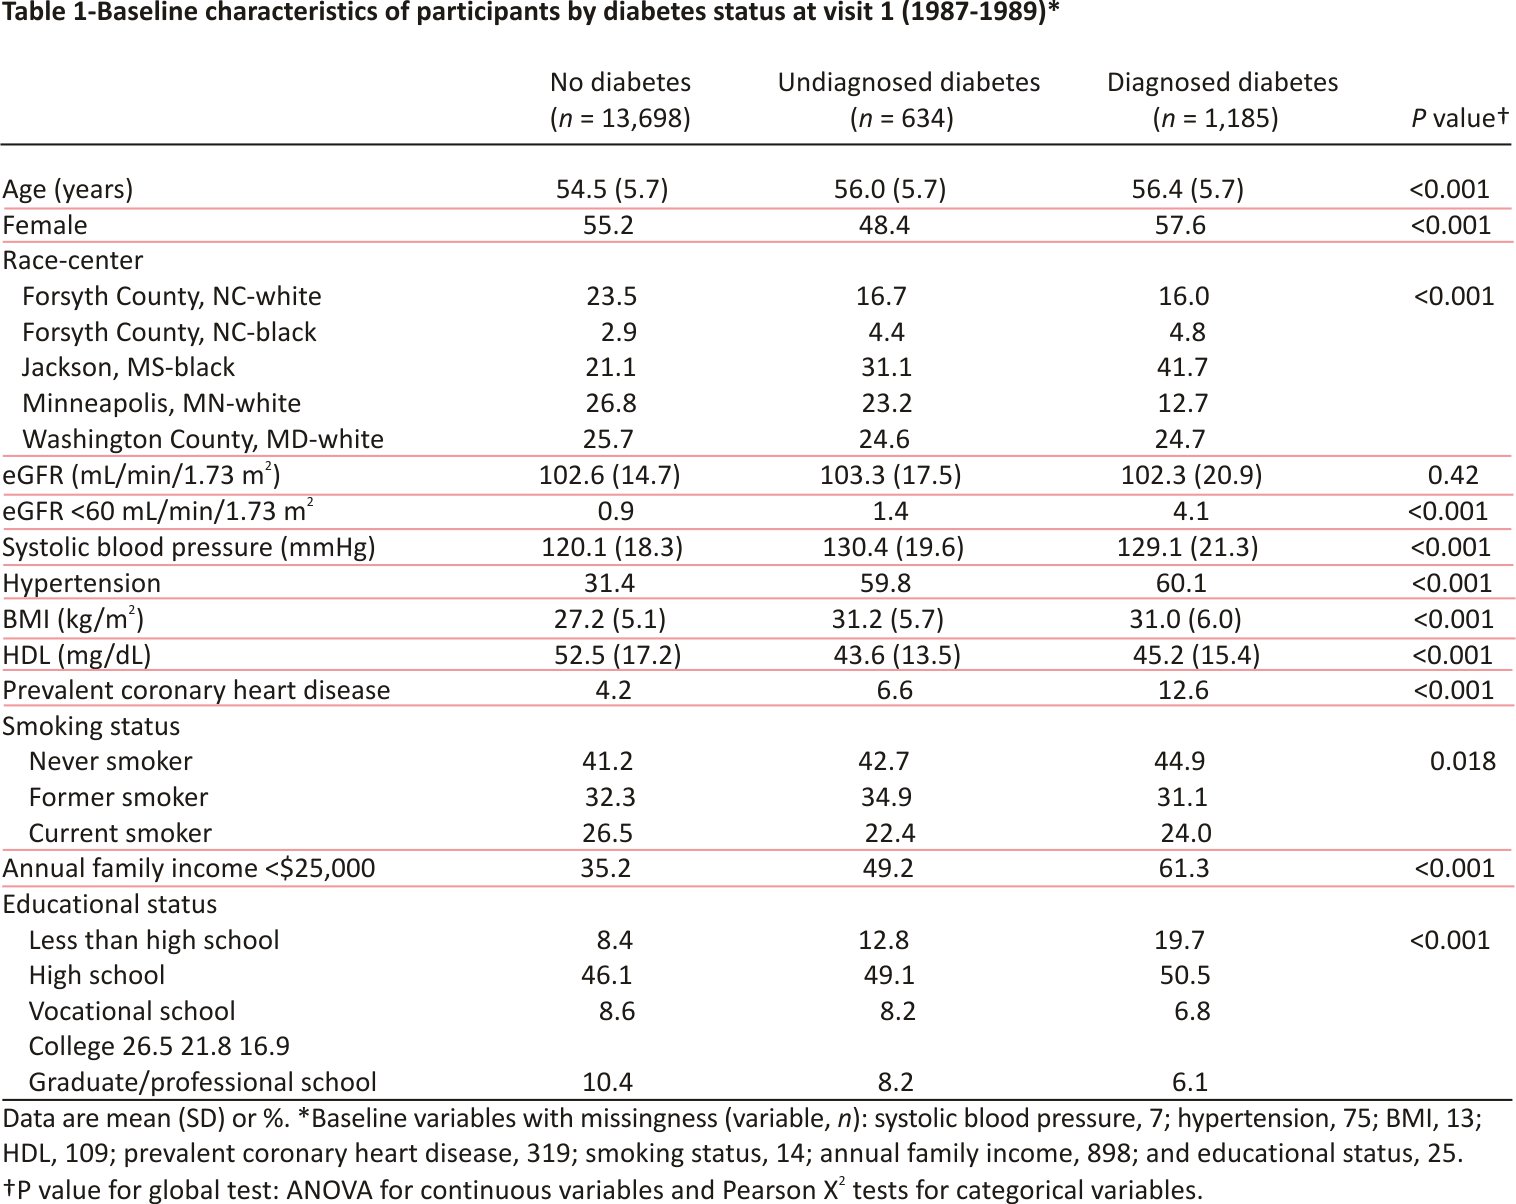
At baseline, participants with undiagnosed and diagnosed diabetes were older, more likely to be black or have hypertension and coronary heart disease, and had higher mean BMI and lower mean HDL compared with those without diabetes (Table 1). Income and education levels were also lower among those with undiagnosed and diagnosed diabetes compared with those without diabetes.
The decline in eGFR by Diabetes Status
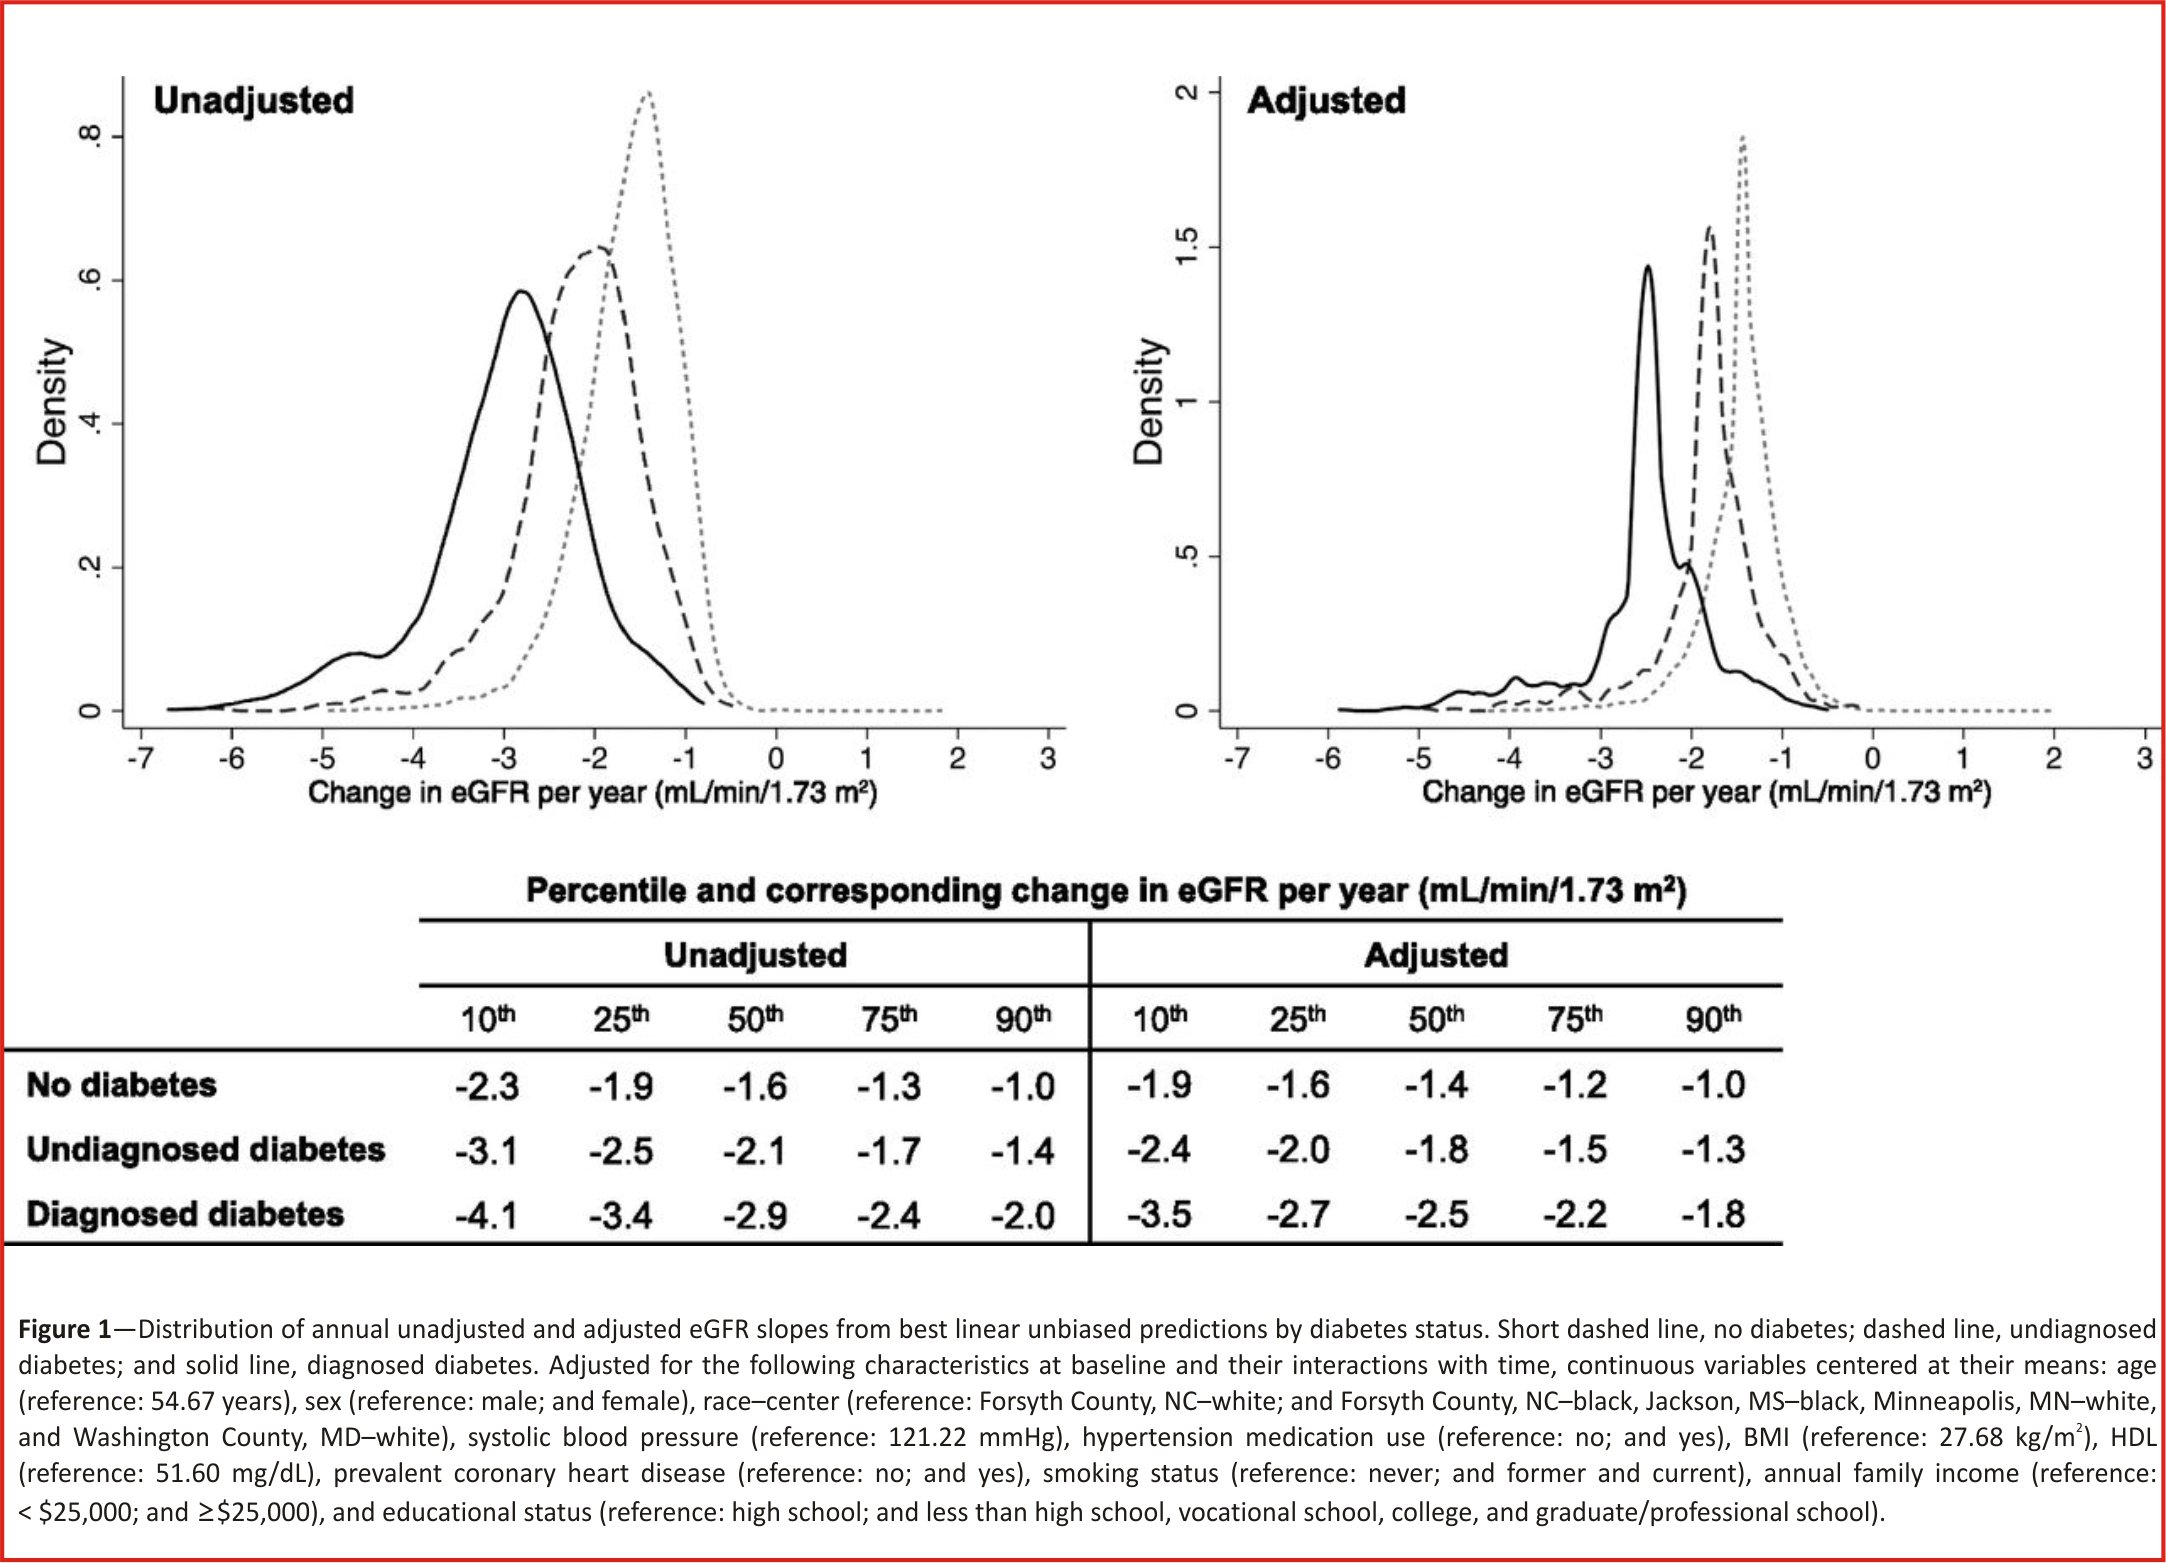
Overall, there was a nearly linear association between eGFR and age over time, regardless of diabetes status (Supplementary Fig. 2). The crude mean annual decline in eGFR was slowest among those without diabetes at baseline (decline of -1.6mL/min/1.73 m2/year [95% CI -1.6 to -1.5]), faster among those with undiagnosed diabetes compared with those without diabetes (decline of -2.1 mL/min/1.73 m2/year [95% CI -2.2 to -2.0]; difference of -0.6 mL/min/1.73 m2/year [95% CI -0.7 to -0.4]), and nearly twice as rapid among those with diagnosed diabetes compared with those without diabetes (decline of -2.9 mL/min/ 1.73 m2/year [95% CI -3.0 to -2.8]; difference of -1.3 mL/min/1.73 m2/year [95% CI -1.4 to -1.2]). Adjustment for diabetes and kidney disease–related risk factors attenuated the results slightly, but those with undiagnosed and diagnosed diabetes still had statistically significantly steeper declines than those without diabetes (decline among no diabetes -1.4 mL/min/1.73m2/year [95% CI -1.5 to -1.4] and decline among undiagnosed diabetes -1.8 mL/min/1.73 m2/year [95% CI -2.0 to -1.7], difference vs. no diabetes of -0.4 mL/min/1.73 m2/year [95% CI -0.5 to -0.3; P < 0.001]; decline among diagnosed diabetes -2.5 mL/min/1.73 m2/year [95% CI -2.6 to -2.4], difference vs. no diabetes of -1.1 mL/min/1.73 m2/year [95% CI -1.2 to -1.0; P < 0.001]).
The decline in eGFR per year varied greatly across individuals, particularly among those with diabetes at baseline (Fig. 1). Crude yearly individual predicted slopes ranged from (10th to 90th percentile) -2.3 to -1.0mL/min/1.73 m2/ year among those without diabetes (median -1.6mL/ min/1.73 m2/year); this range was from -3.1 to -1.4 mL/min/1.73m2/year among those with undiagnosed diabetes (median -2.1 mL/min/1.73 m2/ year) and from -4.1 to -2.0mL/min/1.73 m2/year among those with diagnosed diabetes (median -2.9 mL /min/1.73m2/year). Although adjustment for risk factors related to diabetes and kidney disease reduced some of the variations between diabetes categories, the differences in eGFR decline were still statistically significant.
Factors Associated with eGFR Decline Among Diagnosed Diabetes Group
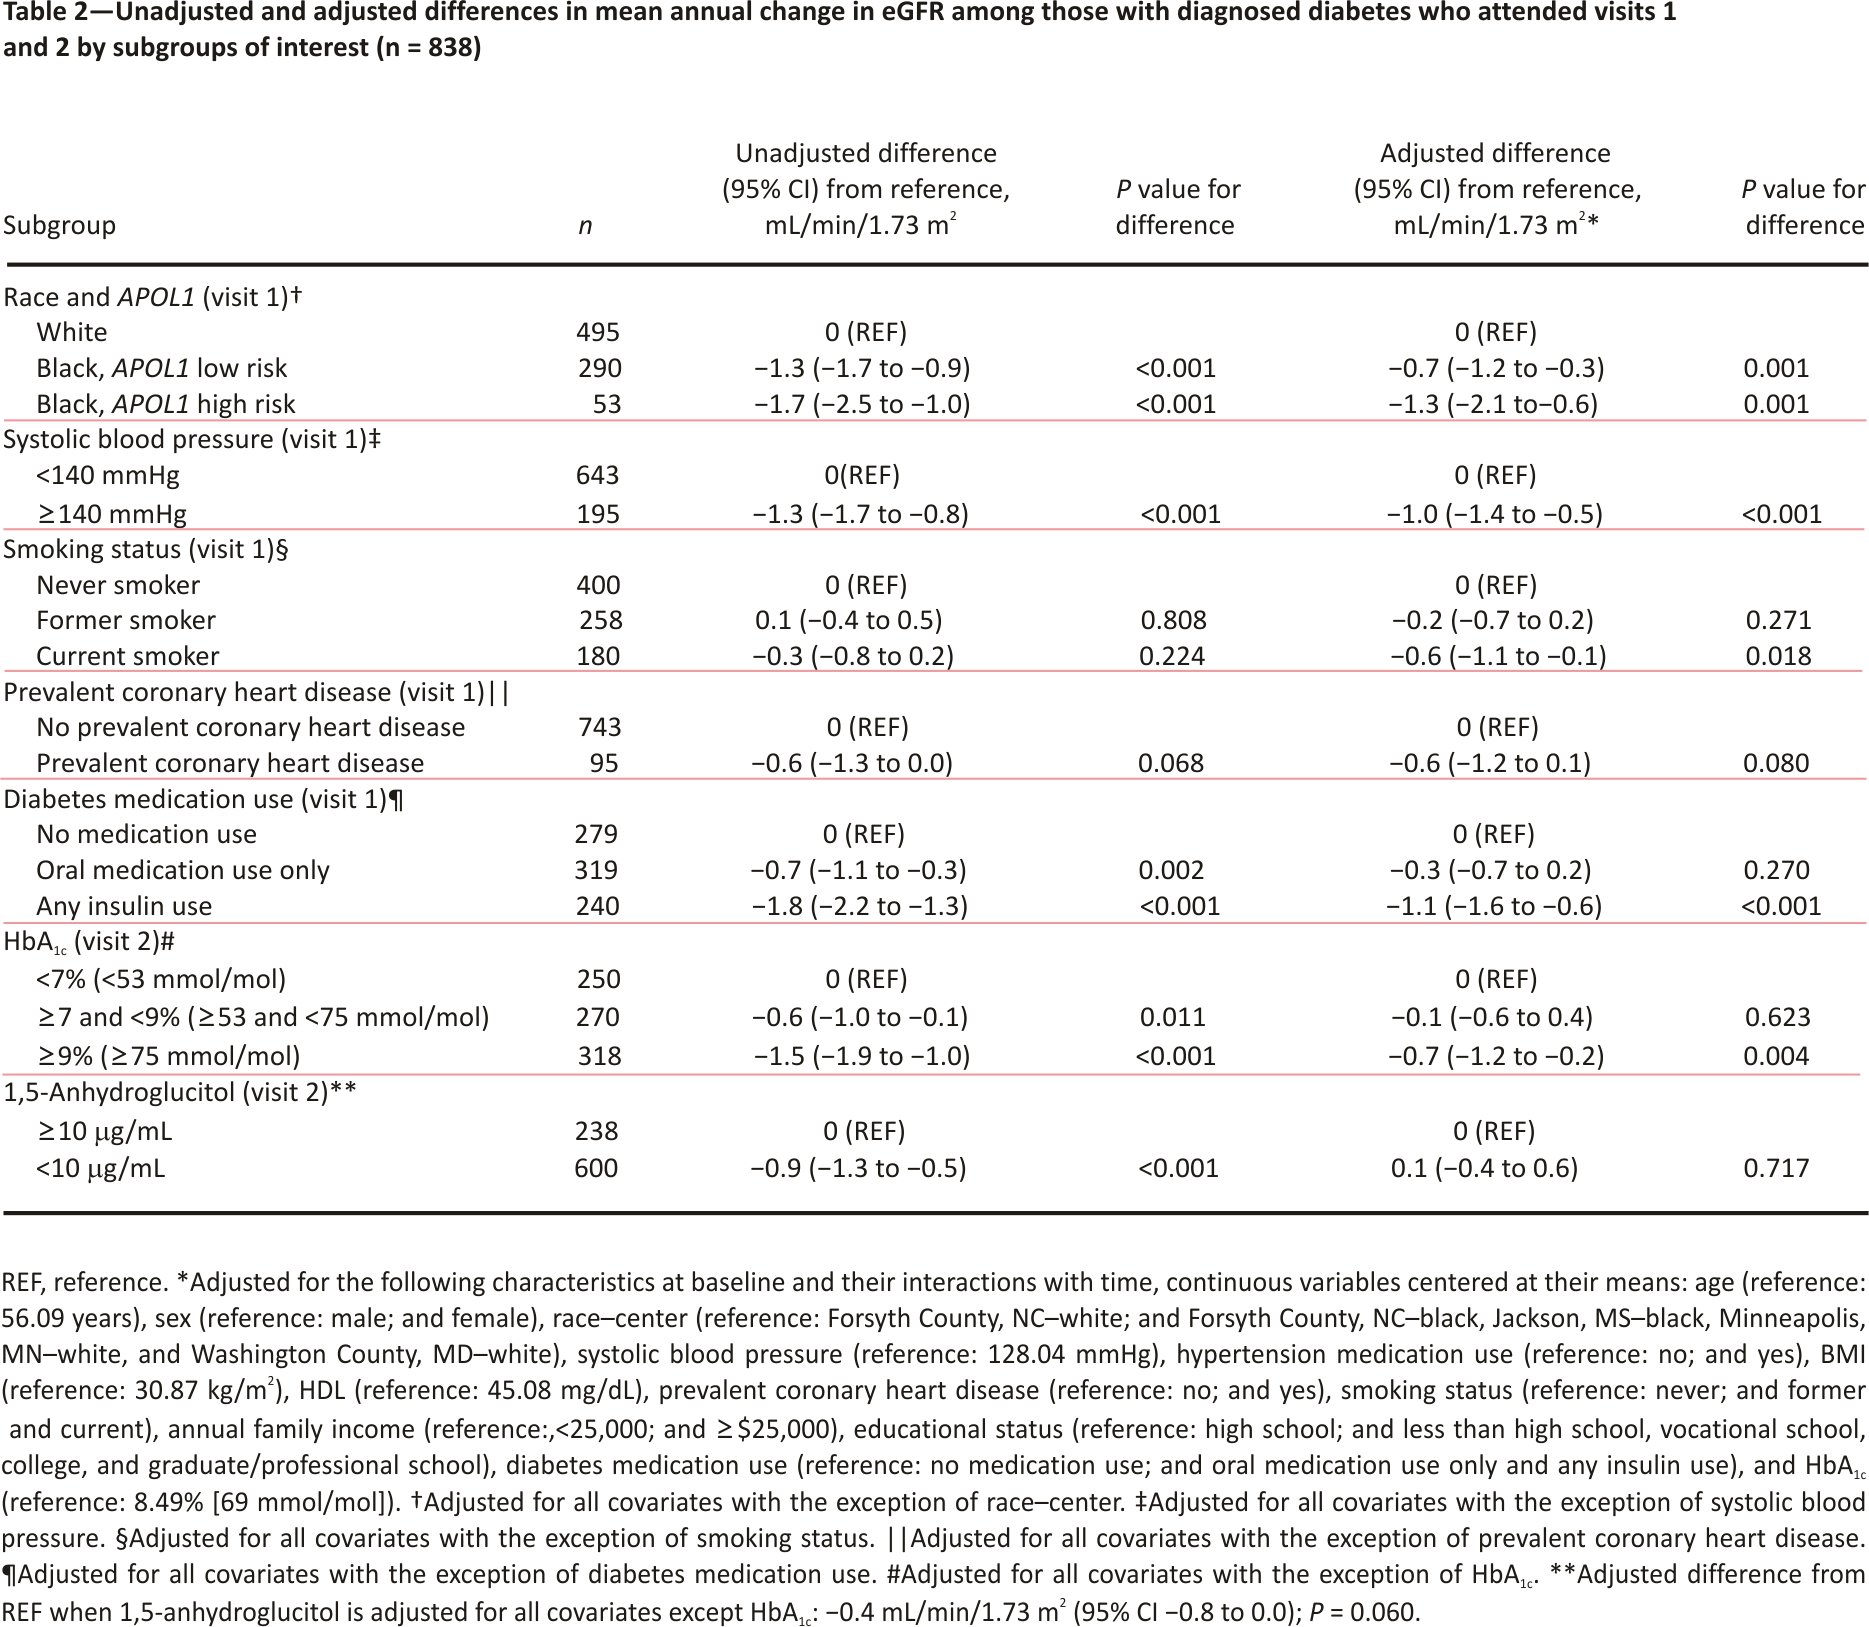
Among participants with diagnosed diabetes at baseline, those who were black, had systolic blood pressure ≥140 mmHg, used diabetes medications, had an HbA1c ≥7% [≥53 mmol/mol], or had 1,5-anhydroglucitol <10 μg/mL were at risk for steeper annual declines than their counterparts (Table 2). Smoking status and prevalent coronary heart disease were not associated with significantly steeper eGFR decline in unadjusted analyses. Adjustment for risk factors, diabetes medication use, and HbA1c attenuated the differences in decline for all subgroups with the exception of smoking status, leaving black race along with APOL1-susceptible genotype, systolic blood pressure ≥140 mmHg, current smoking, insulin use, and HbA1c ≥9% [≥75 mmol/mol] as the risk factors indicative of steeper decline.
eGFR Trajectories by Time Period
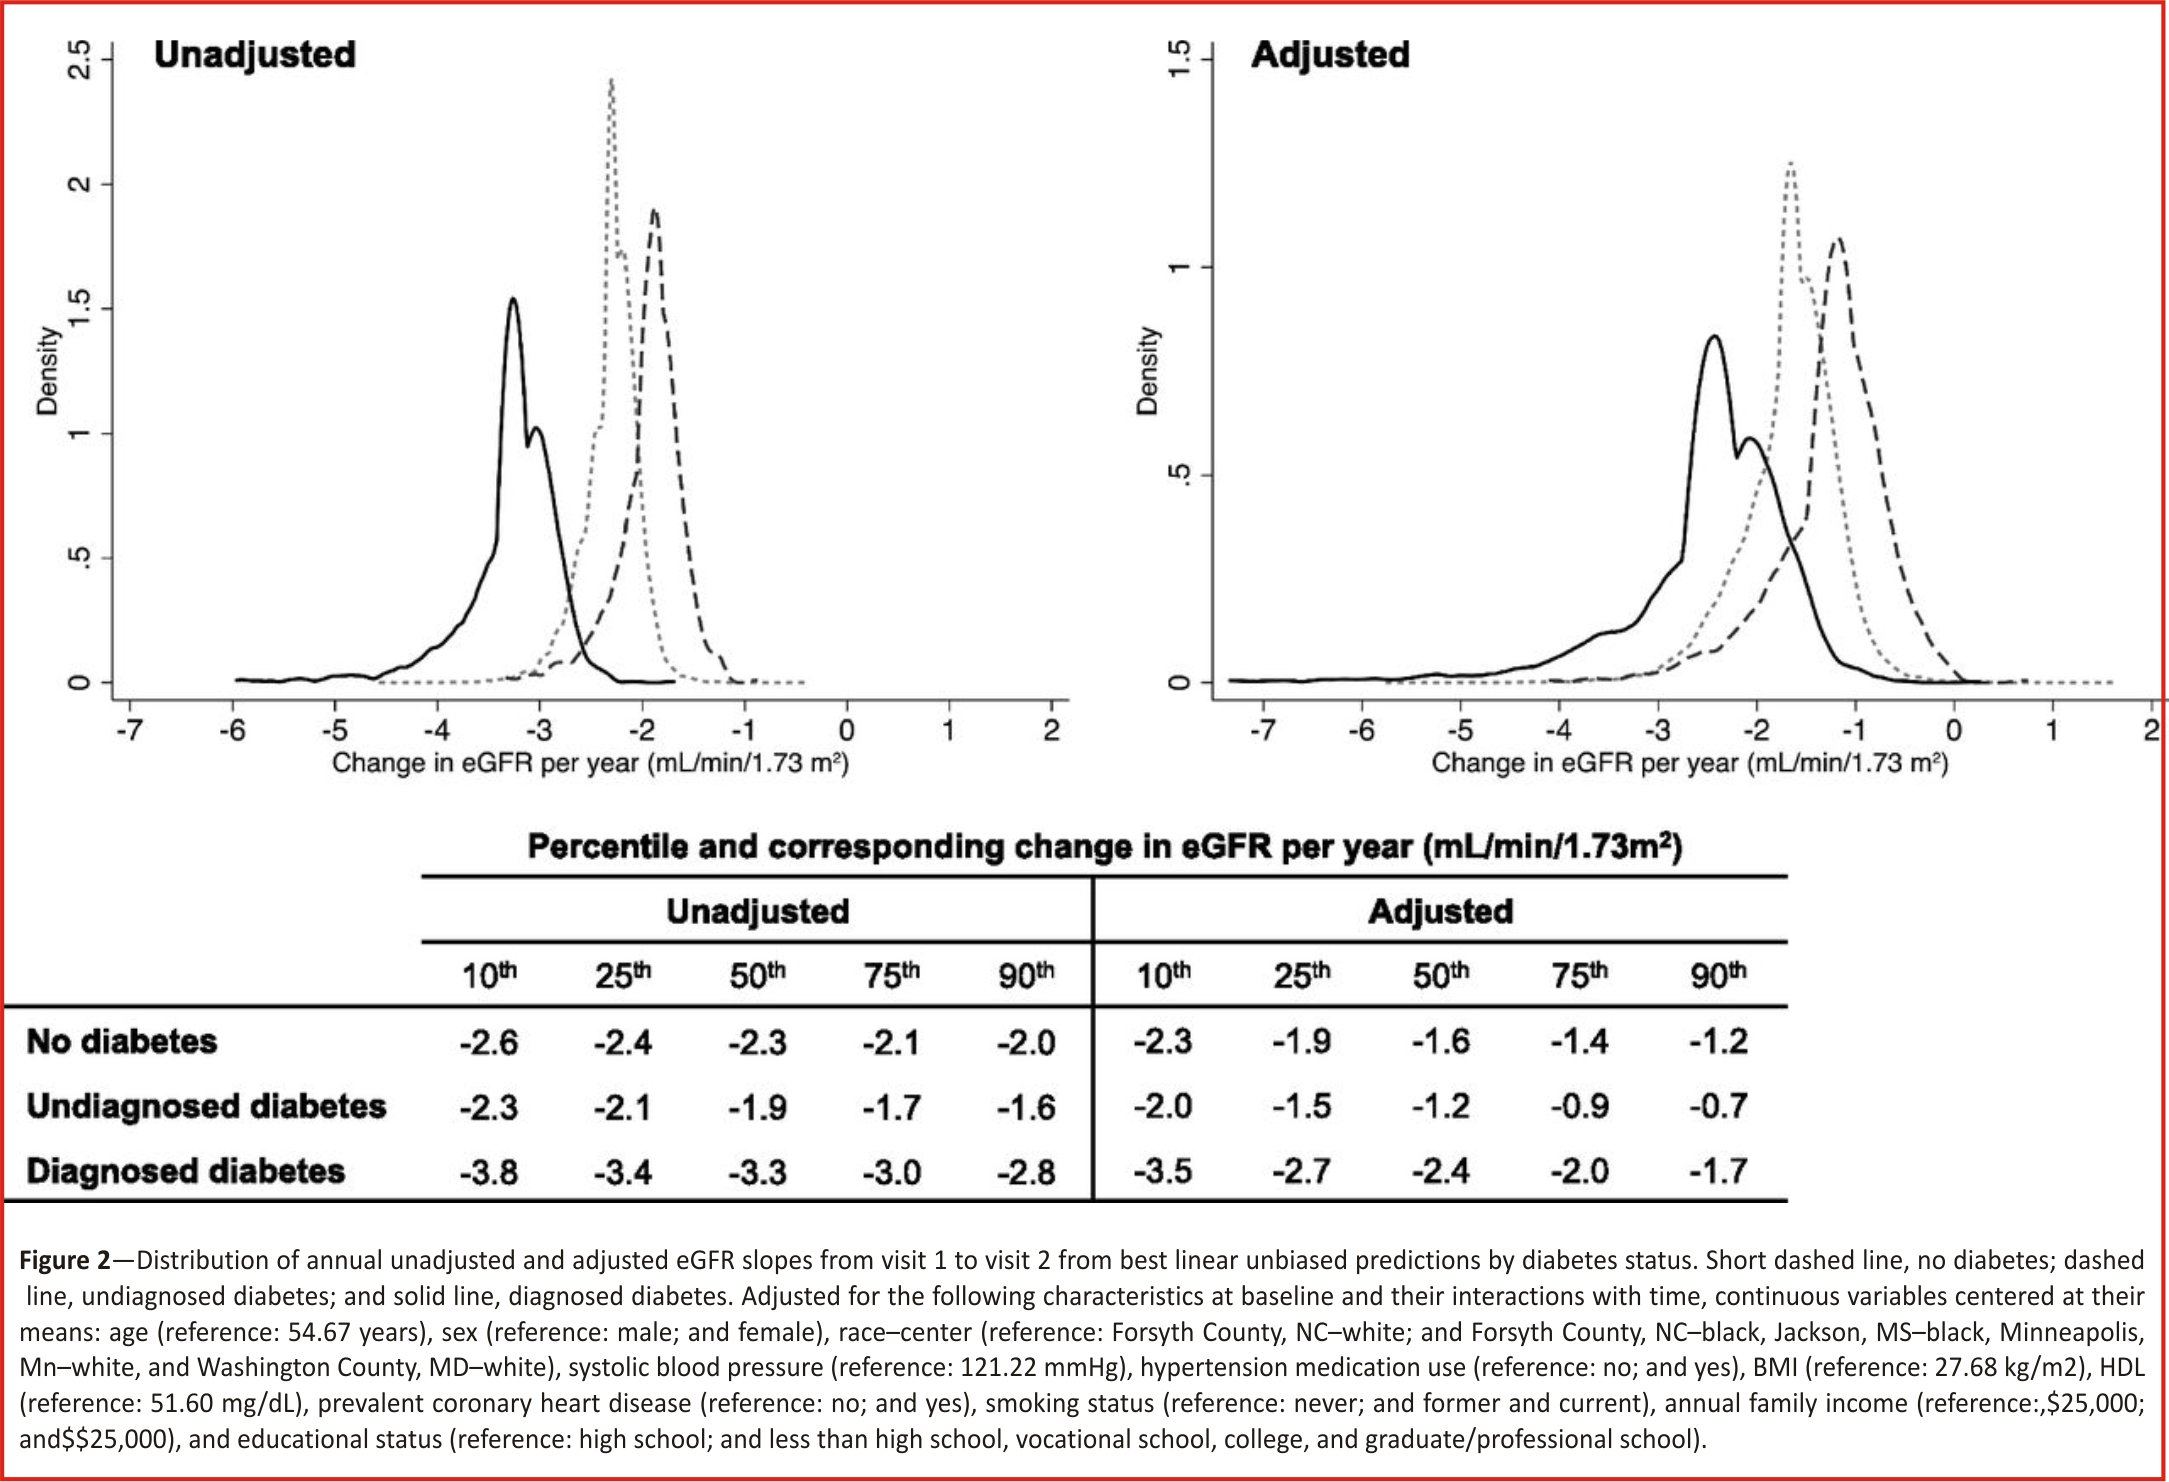
When we explored the effect of diabetes on eGFR decline in two different time periods, we saw potential evidence of hyperfiltration. From visit 1 to visit 2, the distribution of adjusted decline in eGFR among those with undiagnosed diabetes at baseline was less negative than those without diabetes, suggesting that they did not experience as much decline over the 3-year interval (Fig. 2).
Similarly, the adjusted mean annual decline in eGFR was largest among those with diagnosed diabetes, followed by those without diabetes and then by those with undiagnosed diabetes at baseline (-2.5 mL /min/1.73 m2/year [95% CI -2.8 to -2.1], -1.7 mL/ min/ 1.73 m2/year [95% CI -1.9 to -1.4] and -1.3 mL/min/1.73 m2/year [95% CI -1.7 to -0.8], respectively). This resulted in a difference in slope over the first 3 years, comparing undiagnosed to no diabetes at baseline, of 0.4 mL/min /1.73 m2/year (95% CI 0.1 –0.8). The unadjusted distribution of slopes and mean decline followed a similar pattern. Additionally, those with undiagnosed diabetes showed a suggestion of higher eGFR at baseline than those without diabetes at baseline in the unadjusted model (0.7 mL/min/1.73 m2 [95% CI -0.6 to 2.0]), which was statistically significantly higher after adjustment (2.3 mL/min/ 1.73 m2 [95% CI 1.1–3.4]).
Over the remainder of follow-up, from visit 2 to visit 5, we observed that the distributions of unadjusted and adjusted slopes among those with undiagnosed diabetes at baseline were more negative than those without diabetes at baseline (Supplementary Fig. 3).
Sensitivity analyses without imputation of eGFR for those who developed end-stage renal disease attenuated the values of the mean annual declines in eGFR, but the significant differences between diabetes categories remained (Supplementary Table 1).
CONCLUSIONS
In this perspective, community-based cohort followed over 26 years, we observed that diabetes is an important risk factor for kidney function decline. Persons with undiagnosed diabetes at baseline were also at higher risk of eGFR decline; interestingly, this followed a period of relatively little average eGFR decline, which may reflect early hyperfiltration. Large individual variation in eGFR trajectories was observed, particularly among persons with diabetes, with race, systolic blood pressure, and glycemia explaining some of the risk differences. Given the well-established evidence that glycemic control prevents or slows microvascular damage, our findings reinforce the need for early diagnosis of diabetes and glycemic control following diagnosis 16–18. Our results also suggest that racial disparities persist over and above measured genetic and traditional risk factors.
Few other community-based studies have evaluated differences in kidney function decline by diabetes status over a long period through mid-and late life. One study of 10,184 Canadians aged≥66 years with creatinine measured during outpatient visits showed results largely consistent with our findings but with much shorter follow-up (median of 2 years) 19.
Other studies of eGFR change in a general population have found smaller declines than our results 20,21. A study conducted in Japanese participants aged 40–79 years found a decline of only -0.4 mL/min/1.73 m2/year over the course of two assessments 10 years apart (compared with our estimate among those without diabetes: -1.6 mL/min/1.73 m2 /year). This is particularly interesting, as Japan is known to have a higher prevalence of CKD and end-stage renal disease than the U.S. 20. However, this study evaluated participants over a shorter time frame and required attendance at both assessments, which may have decreased the likelihood of capturing severe cases and resulted in underestimation of decline.
The Baltimore Longitudinal Study of Aging also assessed kidney function over time in a general population of 446 men, ranging in age from 22 to 97 years at baseline, each with up to 14 measurements of creatinine clearance assessed between 1958 and 1981 21. They also found a smaller decline than we did (-0.8 mL/min/year), although this study also had notable differences. Their main analysis excluded participants with hypertension and a history of renal disease or urinary tract infection and those treated with diuretics and/or antihypertensive medications. Without those exclusions, their overall estimate was -1.1 mL/min/year, which better reflects a community-based population and our results. The study also took place prior to ARIC, and risk factor and treatment patterns may have differed due to secular trends. In addition, they used creatinine clearance instead of eGFR as a measure of kidney function, and although this may not affect the computation of change, creatinine clearance estimates are known to be higher than GFR 22.
In our evaluation of risk factors that might explain the variation in decline seen among those with diagnosed diabetes, we observed that black race, systolic blood pressure ≥140 mmHg, insulin use, and HbA1c ≥9% (≥75 mmol/mol) were particularly important. Although the APOL1 high-risk genotype is a known risk factor for eGFR decline, African Americans with low-risk APOL1 status continued to be at higher risk than whites even after adjustment for traditional risk factors, diabetes medication use, and HbA1c. This suggests there could be differences over time by risk factors, diabetes severity, access to health care, quality of health care, or health care utilization not accounted for in our analysis.
Our results are relevant to the design and conduct of clinical trials. Hard clinical outcomes like end-stage renal disease are relatively rare, and a 30–40% decline in eGFR is now accepted as a surrogate endpoint for CKD progression 4. We provide data on patient subgroups that may experience accelerated trajectories of kidney function decline, which has implications for estimating sample size and ensuring adequate power in future clinical trials. Our results also suggest that endpoints of eGFR decline might not be appropriate for patients with new-onset diabetes, in whom declines may actually be slower than among persons without diabetes.
Slower eGFR decline among those with undiagnosed diabetes, who are likely early in the course of diabetes, is consistent with the hypothesis of hyperfiltration. Similar to other studies, we found that persons with undiagnosed diabetes had higher GFR at the outset, but this was a transient phenomenon, as they ultimately experienced larger declines in kidney function than those without diabetes over the course of follow-up 23–25. Whether hyperfiltration is a universal aspect of early disease and, if not, whether it portends worse long-term outcomes is uncertain. Existing studies investigating hyperfiltration as a precursor to adverse kidney outcomes are inconsistent 24,26,27 and often confounded by diabetes severity factors like duration 27. We extended this literature by separating undiagnosed and diagnosed diabetes to help address that confounding.
Our analysis has certain limitations. For our main analysis, we defined diabetes status and covariates at baseline and did not account for changes over time in diabetes status or covariates like subsequent medication use. Detection of possible hyperfiltration was limited to two measurements of eGFR per person over a 3-year time interval and up to three measurements in the subsequent 23 years. Undiagnosed diabetes at visit 1 was defined solely by glucose, which may have led to some misclassification. A single measurement of fasting glucose is prone to measurement error, given that only 76% of those with diabetes diagnosed by single fasting glucose are confirmed by a second measurement 28. This suggests we could have overestimated the prevalence of undiagnosed diabetes, although this bias would be conservative. There were also changes in clinical definitions of diabetes during the study period. At the time of visit 1 (1987–1989), a higher threshold of glucose was recommended for the diagnosis of diabetes (140 mg/ dL). We used a more conservative definition (≥126 mg/dL) for consistency with current clinical guidelines 29. We did not account for competing events (e.g., death) that may have prevented observation of eGFR measurements; diabetes is a strong risk factor for mortality 30. Given the strong association between kidney function decline and mortality 31, this may have resulted in underestimation of differences in trajectories between participants with and without diabetes. Additionally, although we were able to use undiagnosed diabetes to likely capture those early in the course of the disease, we did not have information on diabetes duration at baseline among those with undiagnosed or diagnosed diabetes. Finally, albuminuria, itself a strong predictor of eGFR decline, was not assessed in ARIC until visit 4.
Study strengths include the racially diverse community-based cohort of middle-aged adults in the U.S. in the late 1980s followed through the early 2010s. Changes in kidney function were captured prior to the approval of new diabetes medications with kidney-related effects, such as sodium-glucose cotransporter 2 inhibitors or glucagon-like peptide 1 analogues, which might confound results. We also had complete follow-up for end-stage renal disease from the linkage of ARIC to the USRDS surveillance system, allowing us to account for those who developed the end-stage renal disease, even if they did not return to a study visit.
In conclusion, we found that diabetes was associated with a much steeper kidney function decline in a community-based population followed over 26 years. We quantified the annual expected decline in eGFR among those without diabetes, with undiagnosed diabetes, and with diagnosed diabetes, which may be useful to inform future monitoring and clinical trials. Our results reinforce the importance of glycemic and risk factor control in the prevention of CKD.
Acknowledgements
The authors thank the staff and participants of the ARIC study for their important contributions. Some of the data reported in this study have been supplied by the USRDS registry. The interpretation and reporting of these data are the responsibility of the authors and in no way should be seen as official policy or interpretation of the U.S. government.
Funding
The ARIC study is carried out as a collaborative study supported by National Heart, Lung, and Blood Institute (NHLBI) contracts HHSN26820 1700001I, HHSN268201700003I, HHS N268201700005I, HHSN26820170 0004I, and HHSN268201 700002I. B.W. and A.K.L. were supported by National Institutes of Health (NIH)/NHLBI grant T32-HL-007024. C.M.R. was supported by a mentored research scientist development grant from the National Institute of Diabetes and Digestive and Kidney Diseases (NIDDK) (K01-DK-107782). E.S. was supported by NIH/NIDDK grants K24-DK-106414 and R01-DK-089174. M.E.G. was supported by NIH/NIDDK grant K08-DK-092287. Reagents for the 1,5-anhydroglucitol assays were donated by the GlycoMark Corporation.
Conflicts of Interest
No potential conflicts of interest relevant to this article were reported.
Author Contributions
B.W. and M.E.G. researched the data and wrote the manuscript. C.M.R., Y.S., A.K.L., J.C., and E.S. reviewed and edited the manuscript. M.E.G. is the guarantor of this work and, as such, had full access to all of the data in the study and takes responsibility for the integrity of the data and the accuracy of the data analysis.
References
1. Menke A, Casagrande S, Geiss L, Cowie CC. Prevalence of and trends in diabetes among adults in the United States, 1988-2012. JAMA 2015;314:1021– 1029
2. NCD Risk Factor Collaboration (NCD-RisC). Worldwide trends in diabetes since 1980: a pooled analysis of 751 population-based studies with 4.4 million participants. Lancet 2016; 387: 1513–1530
3. The United States Renal Data System. 2017 USRDS Annual Data Report: Epidemiology of Kidney Disease in the United States. Bethesda, MD, National Institutes of Health, National Institute of Diabetes and Digestive and Kidney Diseases, 2017
4. Levey AS, Inker LA, Matsushita K, et al. GFR decline as an endpoint for clinical trials in CKD: a scientific workshop sponsored by the National Kidney Foundation and the US Food and Drug Administration. AmJ KidneyDis 2014;64:821–835
5. Poretsky L (Ed.). Principles of Diabetes Mellitus. 3rd ed. New York, Springer International Publishing, 2017
6. The ARIC Investigators. The Atherosclerosis Risk in Communities (ARIC) Study: design and objectives. Am J Epidemiol 1989;129:687–702
7. Parrinello CM, Grams ME, Couper D, et al. Recalibration of blood analytes over 25 years in the atherosclerosis risk in communities study: impact of recalibration on chronic kidney disease prevalence and incidence. Clin Chem 2015;61: 938–947
8. Levey AS, Stevens LA, Schmid CH, et al.; CKD-EPI (Chronic Kidney Disease Epidemiology Collaboration). A new equation to estimate glomerular filtration rate [published correction appears in Ann Intern Med 2011; 155:408]. Ann Intern Med 2009; 150:604–612
9. Rebholz CM, Coresh J, Ballew SH, et al. Kidney failure and ESRD in the Atherosclerosis Risk in Communities (ARIC) study: comparing ascertainment of treated and untreated kidney failure in a cohort study. Am J Kidney Dis 2015;66:231–239
10. ARIC Study Investigators. Atherosclerosis Risk in Communities Study protocol manual 2: cohort component procedures, version 2.0 [Internet], 1988. Chapel Hill, NC, ARIC Coordinating Center. Available from https://www2.cscc. unc.edu/aric/sites/default/files/public/manuals/ Cohort_Procedures.1_2.pdf. Accessed 8 January 2018
11. ARIC Study Investigators. Atherosclerosis Risk in Communities Study protocol manual 11: sitting blood pressure and postural change in blood pressure and heart rate, version 1.0 [Internet], 1987. Available from https://www2.cscc.unc.edu/aric/sites/default/files/ public/manuals /Sitting_Blood_Pressure_and_Postural_Changes_in_Blood_Pressure_and_Heart_Rate.1_11.pdf. Accessed 8 January 2018
12. Parsa A, Kao WH, Xie D, et al.; AASK Study Investigators; CRIC Study Investigators. APOL1 risk variants, race, and progression of chronic kidney disease. N Engl J Med 2013; 369:2183–2196
13. Grams ME, Rebholz CM, Chen Y, et al. Race, APOL1 risk, and eGFR decline in the general population. JAmSoc Nephrol 2016;27:2842– 2850
14. Selvin E, Coresh J, Zhu H, Folsom A, Steffes MW. Measurement of HbA1c from stored whole blood samples in the Atherosclerosis Risk in Communities study. J Diabetes 2010;2:118–124
15. Low S, Lim SC, Yeoh LY, et al. Effect of long-term glycemic variability on estimated glomerular filtration rate decline among patients with type 2 diabetes mellitus: insights from the Diabetic Nephropathy Cohort in Singapore. J Diabetes 2017;9:908– 919
16. Ismail-Beigi F, Craven T, Banerji MA, et al.; ACCORD trial group. Effect of intensive treatment of hyperglycaemia on microvascular outcomes in type 2 diabetes: an analysis of the ACCORD randomised trial. Lancet 2010;376: 419–430
17. Patel A, MacMahon S, Chalmers J, et al.; ADVANCE Collaborative Group. Intensive blood glucose control and vascular outcomes in patients with type 2 diabetes. N Engl J Med 2008; 358:2560–2572
18. Duckworth W, Abraira C, Moritz T, et al.; VADT Investigators. Glucose control and vascular complications in veterans with type 2 diabetes. N Engl J Med 2009;360:129–139
19. Hemmelgarn BR, Zhang J, Manns BJ, et al. Progression of kidney dysfunction in the community-dwelling elderly. Kidney Int 2006; 69: 2155–2161
20. Imai E, Horio M, Yamagata K, et al. Slower decline of glomerular filtration rate in the Japanese general population: a longitudinal 10-year follow-up study. Hypertens Res 2008;31:433–441
21. Lindeman RD, Tobin J, Shock NW. Longitudinal studies on the rate of decline in renal function with age. J Am Geriatr Soc 1985;33:278–285
22. National Kidney Foundation. Frequently asked questions about GFR estimates [Internet], 2014.NewYork, NY, National Kidney Foundation. Available from https://www.kidney. org/sites/default/files/docs/12-10-4004_abe_faqs_ aboutgfrrev1b_singleb.pdf. Accessed 8 January 2018
23. Nelson RG, Bennett PH, Beck GJ, et al.; Diabetic Renal Disease Study Group. Development and progression of renal disease in Pima Indians with non-insulin-dependent diabetes mellitus. N Engl J Med 1996;335: 1636–1642
24. Silveiro SP, Friedman R, de Azevedo MJ, Canani LH, Gross JL. Five-year prospective study of glomerular filtration rate and albumin excretion rate in normofiltering and hyperfiltering normoalbuminuric NIDDM patients. Diabetes Care 1996;19:171–174
25. Ruggenenti P, Porrini EL, Gaspari F, et al.; GFR Study Investigators. Glomerular hyperfiltration and renal disease progression in type 2 diabetes. Diabetes Care 2012;35: 2061–2068
26. Ficociello LH, Perkins BA, Roshan B, et al. Renal hyperfiltration and the development of microalbuminuria in type 1 diabetes. Diabetes Care 2009;32:889–893
27. Magee GM, Bilous RW, Cardwell CR, Hunter SJ, Kee F, Fogarty DG. Is hyperfiltration associated with the future risk of developing diabetic nephropathy? A meta-analysis. Diabetologia 2009;52:691–697
28. Selvin E, Crainiceanu CM, Brancati FL, Coresh J. Short-term variability in measures of glycemia and implications for the classification of diabetes. Arch Intern Med 2007; 167:1545–1551
29. American Diabetes Association. Standards of Medical Care in Diabetes – 2017. Diabetes Care 2017; 40(Suppl. 1): S1– S135
30. Rao Kondapally Seshasai S, Kaptoge S, Thompson A, et al.; Emerging Risk Factors Collaboration. Diabetes mellitus, fasting glucose, and risk of cause-specific death. N Engl J Med 2011;364:829–841
31. Coresh J, Turin TC, Matsushita K, et al. Decline in estimated glomerular filtration rate and subsequent risk of end-stage renal disease and mortality. JAMA 2014;311:2518 –2531
Credits: Warren B, Rebholz C.M., Sang Y, Lee A.K., Coresh J, Selvin E and Grams M.E. Diabetes and Trajectories of Estimated Glomerular Filtration Rate: A Prospective Cohort Analysis of the Atherosclerosis Risk in Communities Study. Diabetes Care 2018;41:1646–1653. https://doi.org/10.2337/dc18-0277